Grade 5 - Session 1: “Investigating Chemical Reactions”
Session Architect: Aleeza Ayaz - Markhor3D
Session Length: 50-60 minutes
Session Overview
In this engaging session, Grade 5 students will investigate chemical reactions and physical changes using MeasureLab. Through hands-on experiments, they will compare a chemical reaction (baking soda and vinegar) with a physical change (salt dissolving in water), both of which are endothermic (heat-absorbing). Students will use a live temperature plot to observe temperature trends in real-time, recording their findings and exploring the energy transfer during these processes. They will also learn to identify key variables, analyze data, and connect the experiments to real-world examples, building foundational knowledge about chemical reactions, physical changes, and energy transformations.
Learning Objectives:
By the end of this session, students will:
- Familiarize themselves with MeasureLab.
- Understand the difference between physical changes and chemical reactions.
- Learn key signs of a chemical reaction, such as gas production, formation of precipitate and temperature change.
- Explore the concept of energy transfer through endothermic reactions by measuring temperature changes.
- Understand how to read and interpret a live temperature plot from MeasureLab during an experiment.
- Learn what a trend is on a graph and how to spot it using the live temperature plot.
- Observe that both physical changes and chemical reactions can be endothermic.
- Compare and contrast two types of endothermic reactions: a chemical reaction (baking soda and vinegar) and a physical change (dissolving salt in water).
Teacher Resource:
Session File: Ml51.plf (59.1 KB)
Equipment Required:
- MeasureLab with a built-in temperature sensor and temperature probe.
- Substances for reactions:
- Baking soda and vinegar (for a chemical reaction).
- Salt and water (for a physical change).
- Small containers or beakers for mixing substances.
- Laptop or PC for displaying live temperature plots.
- Worksheet for recording observations and measurements.
- Pens, pencils, markers, etc.
Teaching Aids:
- Projector (optional, to display live temperature plots).
Preparation:
This step has to be done before the session on each workstation/apparatus by the teacher/session instructor:
- Make sure that each computer has Physlogger installed and can detect the Measrelab when connected to it using the provided cable.
- Each Measurelab should have access to a power outlet for sensors that require external power. This session uses Temperature Probe which requires external power source to be connected.
- Connect the Temperature Sensor to the Measurelab using the following port:

- Launch the Physlogger application and load the session file provided in the resources section.
Your setup will look something like this:
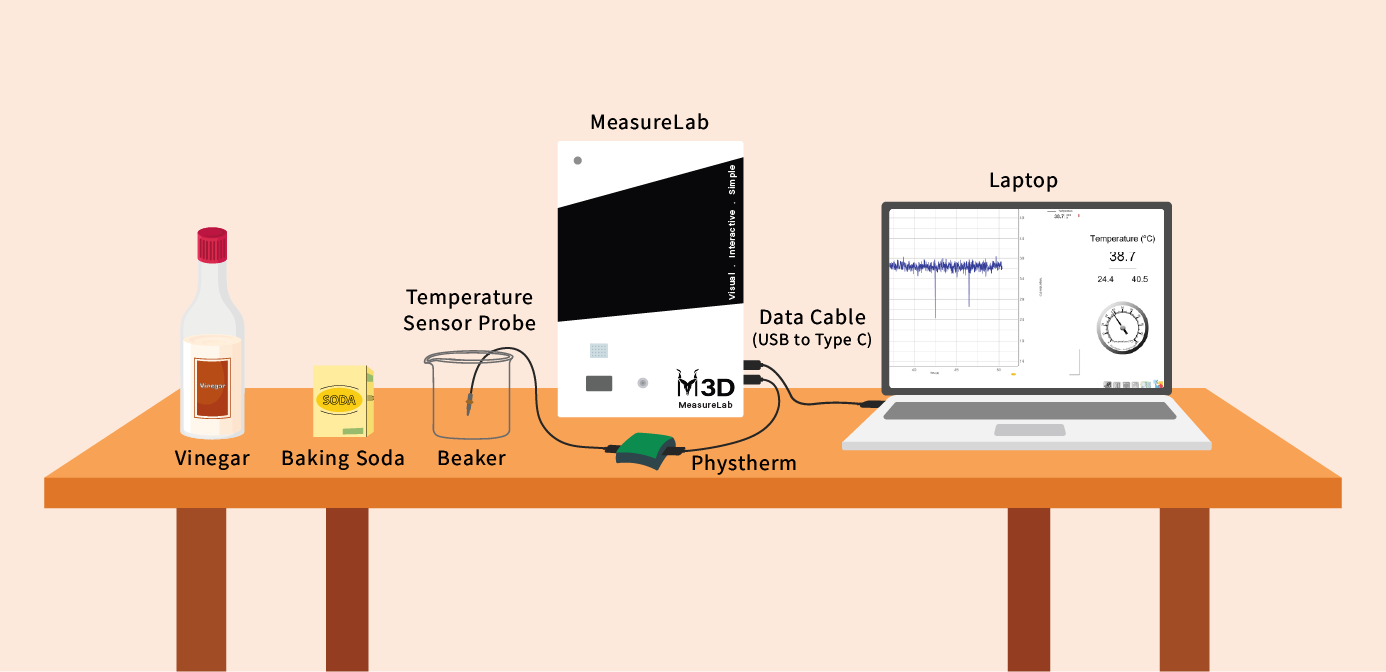
Note: This experiment may cause spillage depending on the amount of baking soda and vinegar being used. Keep the Measurelab away from any sources of liquid spillage to avoid damage.
Introduction: (10 minutes)
You can start by inviting students to recall their own experiences:
“Has anyone ever mixed two things together, like soap and water? What happened when you mixed them?”
Pause to let students share their experiences, encouraging them to think about what they noticed during those mixtures.
“Did anything surprising happen? Maybe bubbles, a change in how the substance looked or felt?”
Allow some time for answers and let students discuss these changes.
Guide them to think deeper:
“When we mix things together, sometimes something new is made, and sometimes it’s not. Can anyone think of an example where something new is created, and another where it stays the same?”
Listen to their ideas and provide support if needed, allowing them to differentiate between examples of chemical and physical changes.
Once students have shared their experiences, move into the experiment:
“Today, we’re going to mix baking soda and vinegar. Based on what you know, what do you think will happen? Will we see any interesting changes?”
Give them a moment to think, encouraging them to make predictions.
“How would we know if a new substance is being made? What signs should we look for?”
This lets them reflect on observable clues in a chemical reaction.
Next, introduce the comparison:
“What about when we mix salt and water? Do you think the salt will change into something else, or will it stay the same?”
Let them share their ideas before moving on to the next question.
“Do you think the temperature will change in either of these experiments? Why or why not?”
Encourage a range of predictions, fostering an open discussion about their reasoning.
Shift into deeper thinking about the importance of measurements:
“When we mix these substances, why do you think it’s important to measure the amounts carefully? What could happen if we don’t get the amounts exactly right?”
Give students a chance to reflect on how precision could affect the outcome.
Introduce the experiment setup and the live plot:
“In today’s experiment, we’ll use a live temperature plot to track what happens during the reactions. What do you think the graph will look like if the temperature goes up? What if it goes down?”
Let them make predictions about the plot.
Hands-On Exploration (15-20 minutes):
Exploring Endothermic Reactions and Detailed Observations
You may start by guiding students to perform precise measurements and use detailed observation skills. They should record both qualitative (e.g., bubbling, color) and quantitative (temperature changes) data.
- Chemical Reaction: Baking Soda and Vinegar (Endothermic Reaction)
- Precise Measurement and Observation:
- You may ask:
“Let’s measure the baking soda and vinegar carefully using a scale and graduated cylinder. Why do you think it’s important that we use the exact same amounts each time?”
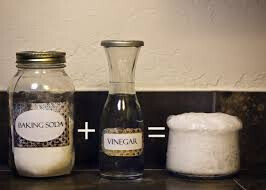
- Guide them to carefully pour the measured vinegar into a beaker and slowly add the measured baking soda.
- Ask them to observe carefully:
“What do you see happening? Is there bubbling? What could the bubbles mean?”
- Recording Data:
- As they observe, encourage them to record quantitative data:
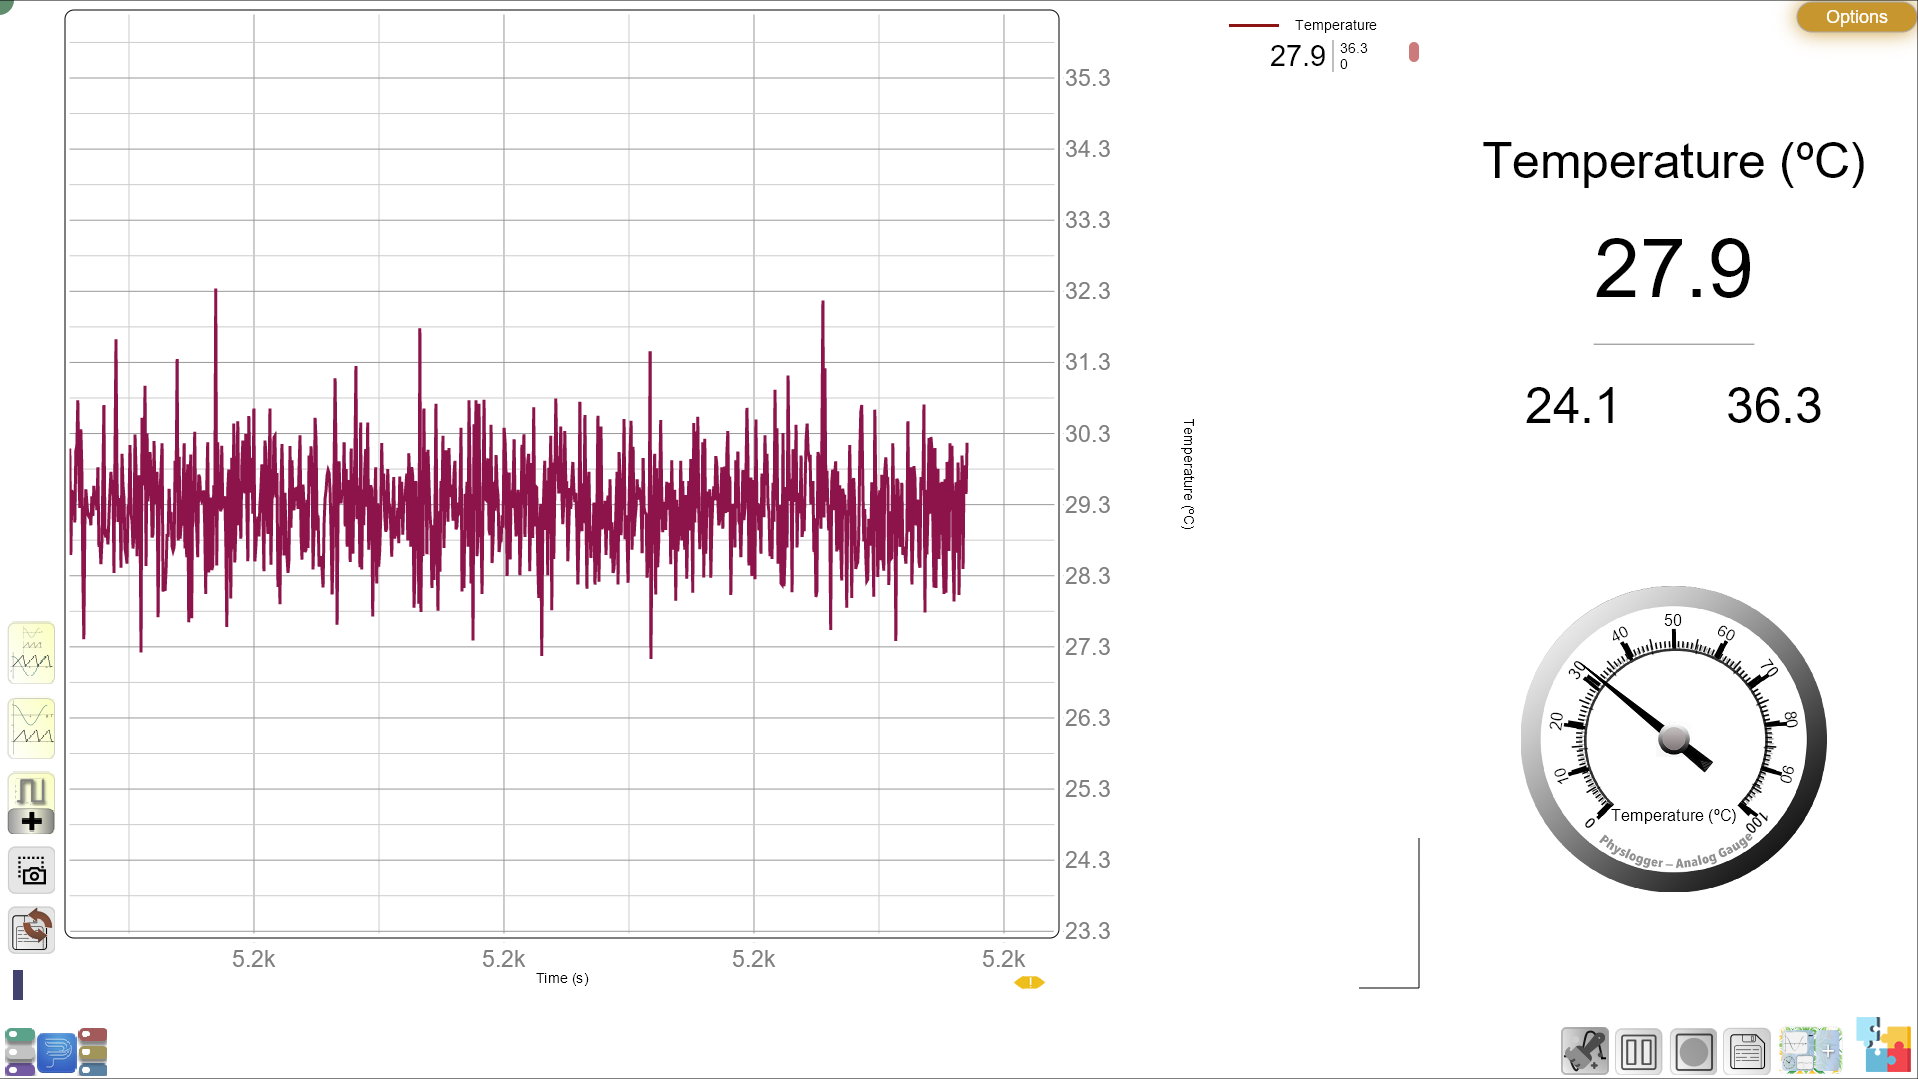
“Let’s write down how much baking soda and vinegar we used. Now look at the temperature—what do you notice? Is it going up or down? Let’s record the exact temperature change.”
- Analyzing the Live Plot:
- Ask them to focus on the live temperature plot:
“Is the line going up or down? What might this tell us about the energy being absorbed or released in this reaction?”
- You may follow up with:
“How would you describe this trend? Is the temperature dropping steadily, or does it level out at some point?”
- Discussing Uncertainty and Error:
- You may ask:
“What if our temperature sensor isn’t perfectly accurate—how would that affect our data? Could small differences in measurement lead to different results? Why is this important in science?”
- Physical Change: Dissolving Salt in Water (Endothermic Reaction)
- Precise Measurement and Observation:
- You may ask:
“Now, let’s measure the salt and water carefully. Why do you think the exact amounts of salt and water are important?”
- Guide them to dissolve the salt in the water and observe:
“What do you see? Does the salt disappear, or does something else happen?”
- Recording Data:
- Encourage them to record both qualitative and quantitative data:
“Let’s write down the amount of salt and water we used. Now, check the temperature. Is it going up or down?”
- Analyzing the Live Plot:
- You may ask:
“Look at the live plot—do you see a trend? Is the temperature changing as much as it did in the baking soda and vinegar experiment?”
Explaining Endothermic and Exothermic Reactions:
You may start by asking:
- “We saw the temperature go down in both experiments. What does this tell us about what’s happening to the energy?”
- “Can you think of any other reactions that might make things warmer instead of cooler?”
After gathering responses, explain:
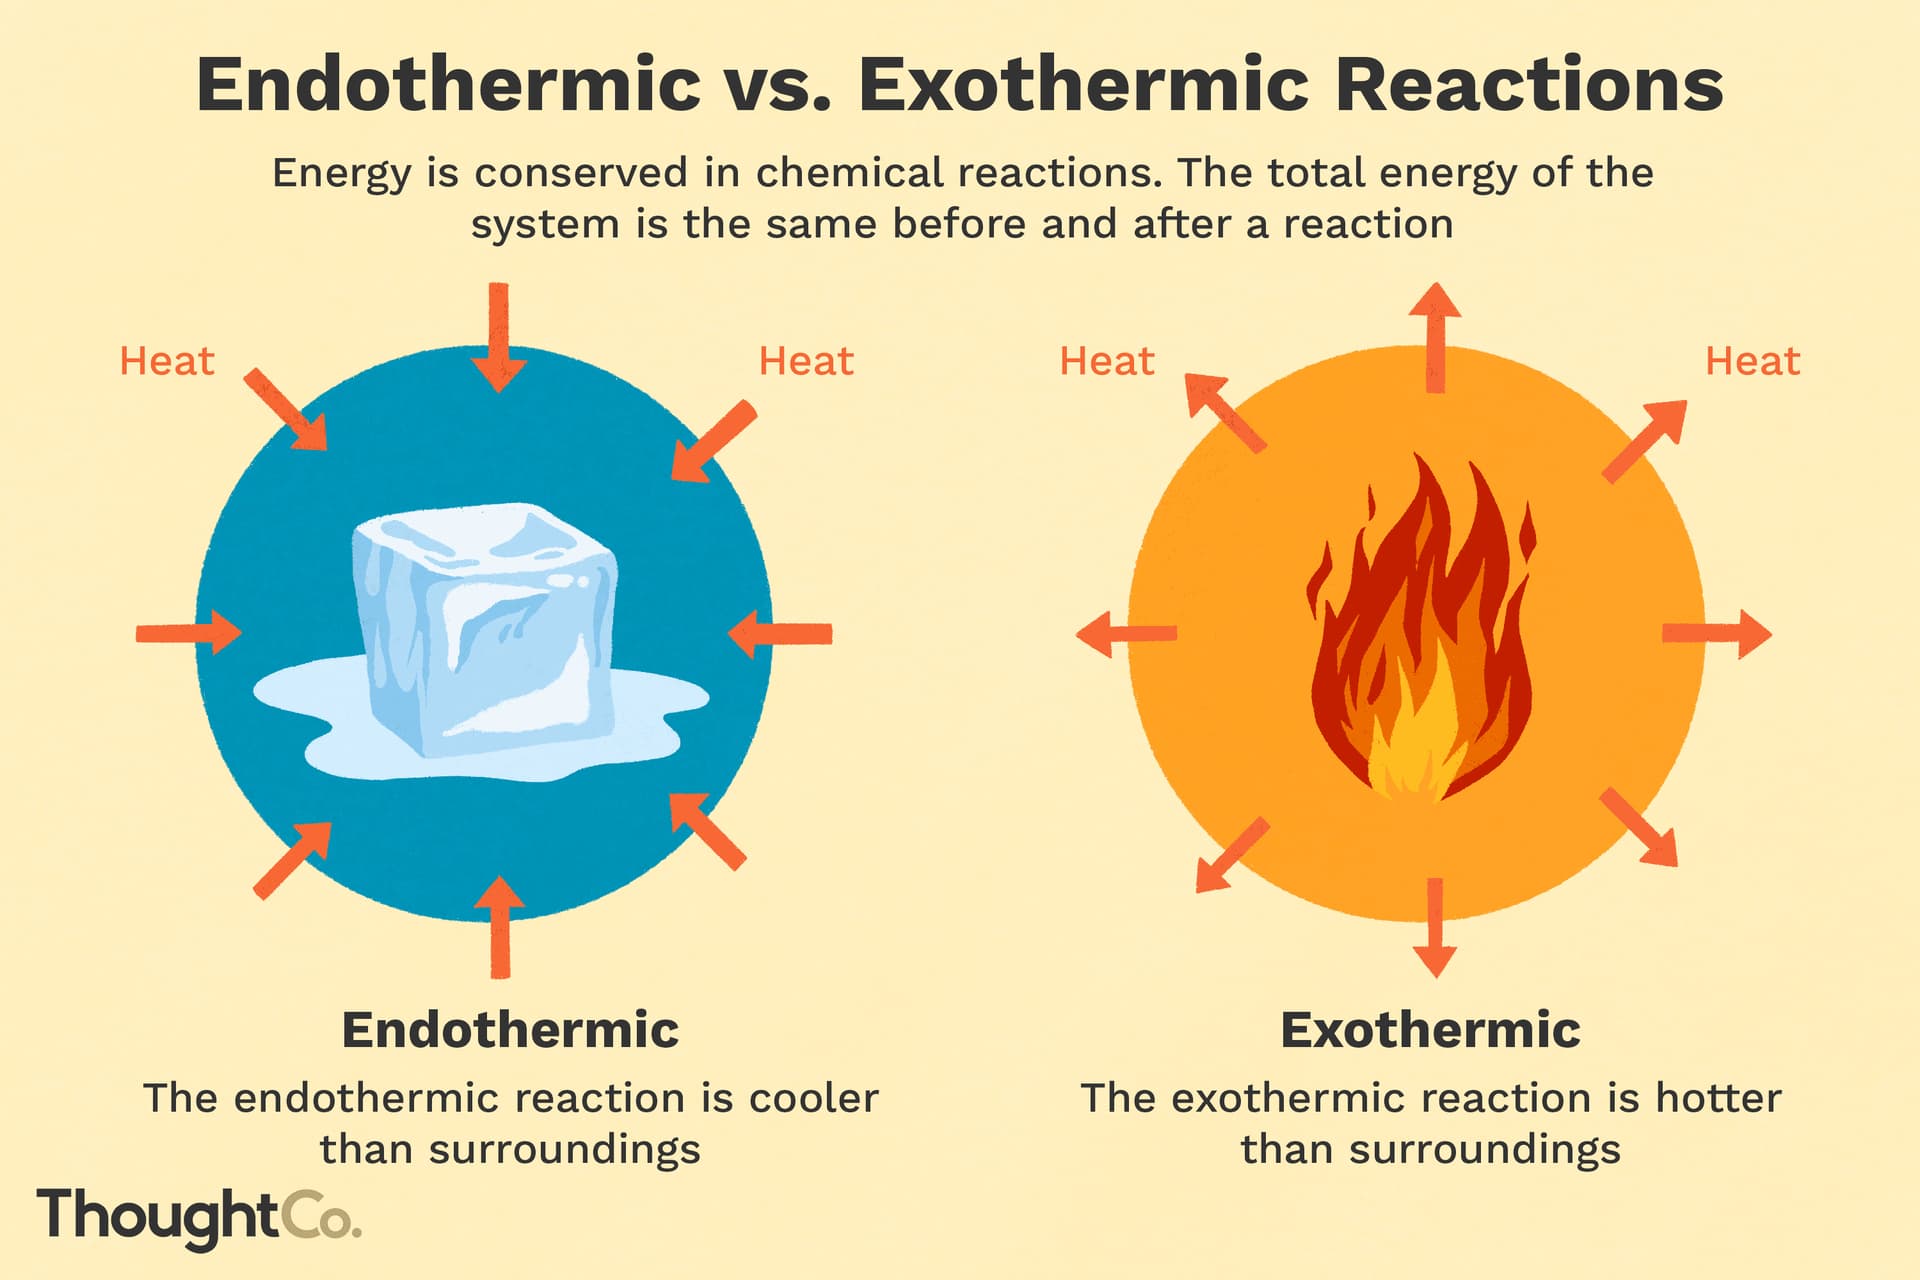
- Endothermic Reactions:
“In both of our experiments, we saw the temperature drop because they were endothermic reactions. This means they absorbed heat from the surroundings, making the temperature go down.”
- Exothermic Reactions:
“In other reactions, the temperature goes up because heat is released. These are called exothermic reactions, like when something burns or when fireworks go off.”
You may provide real-life examples:
- “When you use ice to cool down a drink, it absorbs heat from the liquid—just like in an endothermic reaction.”
- “In an exothermic reaction, like burning wood, heat is released, and you can feel it warming the surroundings.”
Guided Activity: (15-20 minutes)
Worksheet Activity:
- Observing Chemical and Physical Changes:
- Students will record their observations of both the chemical reaction and the physical change, noting temperature changes and how the live plot changed during the experiment.
| Experiment | Temperature Change (°C) | Live Plot Trend (Up/Down) | Other Signs (Bubbles, Gas) |
|---|---|---|---|
| Baking Soda + Vinegar | |||
| Salt + Water |
- Physical Change vs Chemical Reaction:
- Students will identify which experiment was a chemical reaction and which was a physical change. They will explain how they know.
| Experiment | Physical or Chemical Change? | How Do You Know? |
|---|---|---|
| Baking Soda + Vinegar | ||
| Salt + Water |
- Variables Identification:
- Students will identify the dependent, independent, and controlled variables for each experiment.
| Variable Type | Description |
|---|---|
| Independent Variable | What we are changing (e.g., substance mixed) |
| Dependent Variable | What we are measuring (e.g., temperature change) |
| Controlled Variables | What stays the same (e.g., amount of substance, beaker size) |
-
Follow-Up Questions:
-
What were the main signs that a chemical reaction took place?
-
How was the salt and water mixture different from the baking soda and vinegar reaction?
-
What did the live temperature plot tell you about what was happening in the reactions?
-
Can you think of some real-life examples of endothermic reactions?
-
Summary and Reflection: (5-10 minutes)
You may summarize the session by saying:
“Today, we saw two different reactions—a chemical reaction and a physical change—but both were endothermic, which means they absorbed heat. We used a live temperature plot to see how the temperature dropped in real-time, and we learned how to spot trends on a graph.”
You may ask students to reflect by answering questions like:
- “Which experiment surprised you more? Why?”
- “How does the live plot help us understand what’s happening in a reaction? How did we observe the trend in temperature?”
Glossary:
- Chemical Reaction: A process where substances change into new substances, often with signs like bubbles, gas production, or temperature shifts.
- Endothermic Reaction: A reaction that absorbs heat, causing the temperature to drop.
- Exothermic Reaction: A reaction that releases heat, causing the temperature to increase.
- Physical Change: A change where the substance stays the same, even if it looks different.
- Live Plot: A real-time graph showing how the temperature changes during an experiment.
- Trend: The pattern or direction you observe on a graph over time.
- Energy Transfer: The movement of energy, like when heat is absorbed or released in a reaction.