Grade 5 - Session 4: “Investigating Fluid Pressure”
Session Architect: Aleeza Ayaz - Markhor3D
Session Length: 50-60 minutes
Session Overview
This session introduces students to the concept of fluid pressure and how it changes with depth. Through hands-on experimentation, students will use a pressure sensor to measure pressure at different depths in a container of water. They will identify key variables, record their measurements, and create a scatter plot to visualize the relationship between depth and pressure. By analyzing their data, students will recognize how fluid pressure increases with depth and connect this to real-world applications like submarines, water tanks, and diving gear. Collaborative discussions will encourage students to reflect on the experiment’s design and the importance of fluid pressure in everyday life.
Learning Objectives:
In this session, students will:
- Understand pressure as the force exerted by particles in a fluid.
- Explore how fluid pressure changes with depth.
- Use a pressure sensor to measure fluid pressure at different depths in water.
- Identify independent, dependent, and controlled variables in the experiment through guided questioning.
- Recognize trends in the data and use a scatter plot to visually analyze the relationship between depth and pressure.
- Relate their findings to real-life examples, such as divers, submarines, and water tanks.
Teacher Resource:
Session File: ML54.plf (59.5 KB)
Equipment Required:
- MeasureLab with built-in pressure sensor attached to a tube.
- Beaker/Container of water (large enough to submerge the tube at various depths).
- Worksheet for recording data, identifying variables, and answering questions.
- Pens, pencils, markers, etc.
- Visual aids (diagrams of water pressure, fluid particles, and everyday applications of fluid pressure).
Teaching Aids:
- Projector to display measurement and live plot from MeasureLab (optional)
Preparation:
This step has to be done before the session on each workstation/apparatus by the teacher/session instructor:
- Make sure that each computer has Physlogger installed and can detect the Measrelab when connected to it using the provided cable.
- Each Measurelab should have access to a power outlet for sensors that require external power. For this session, the built-in Pressure Sensor will be used which require an external power source.
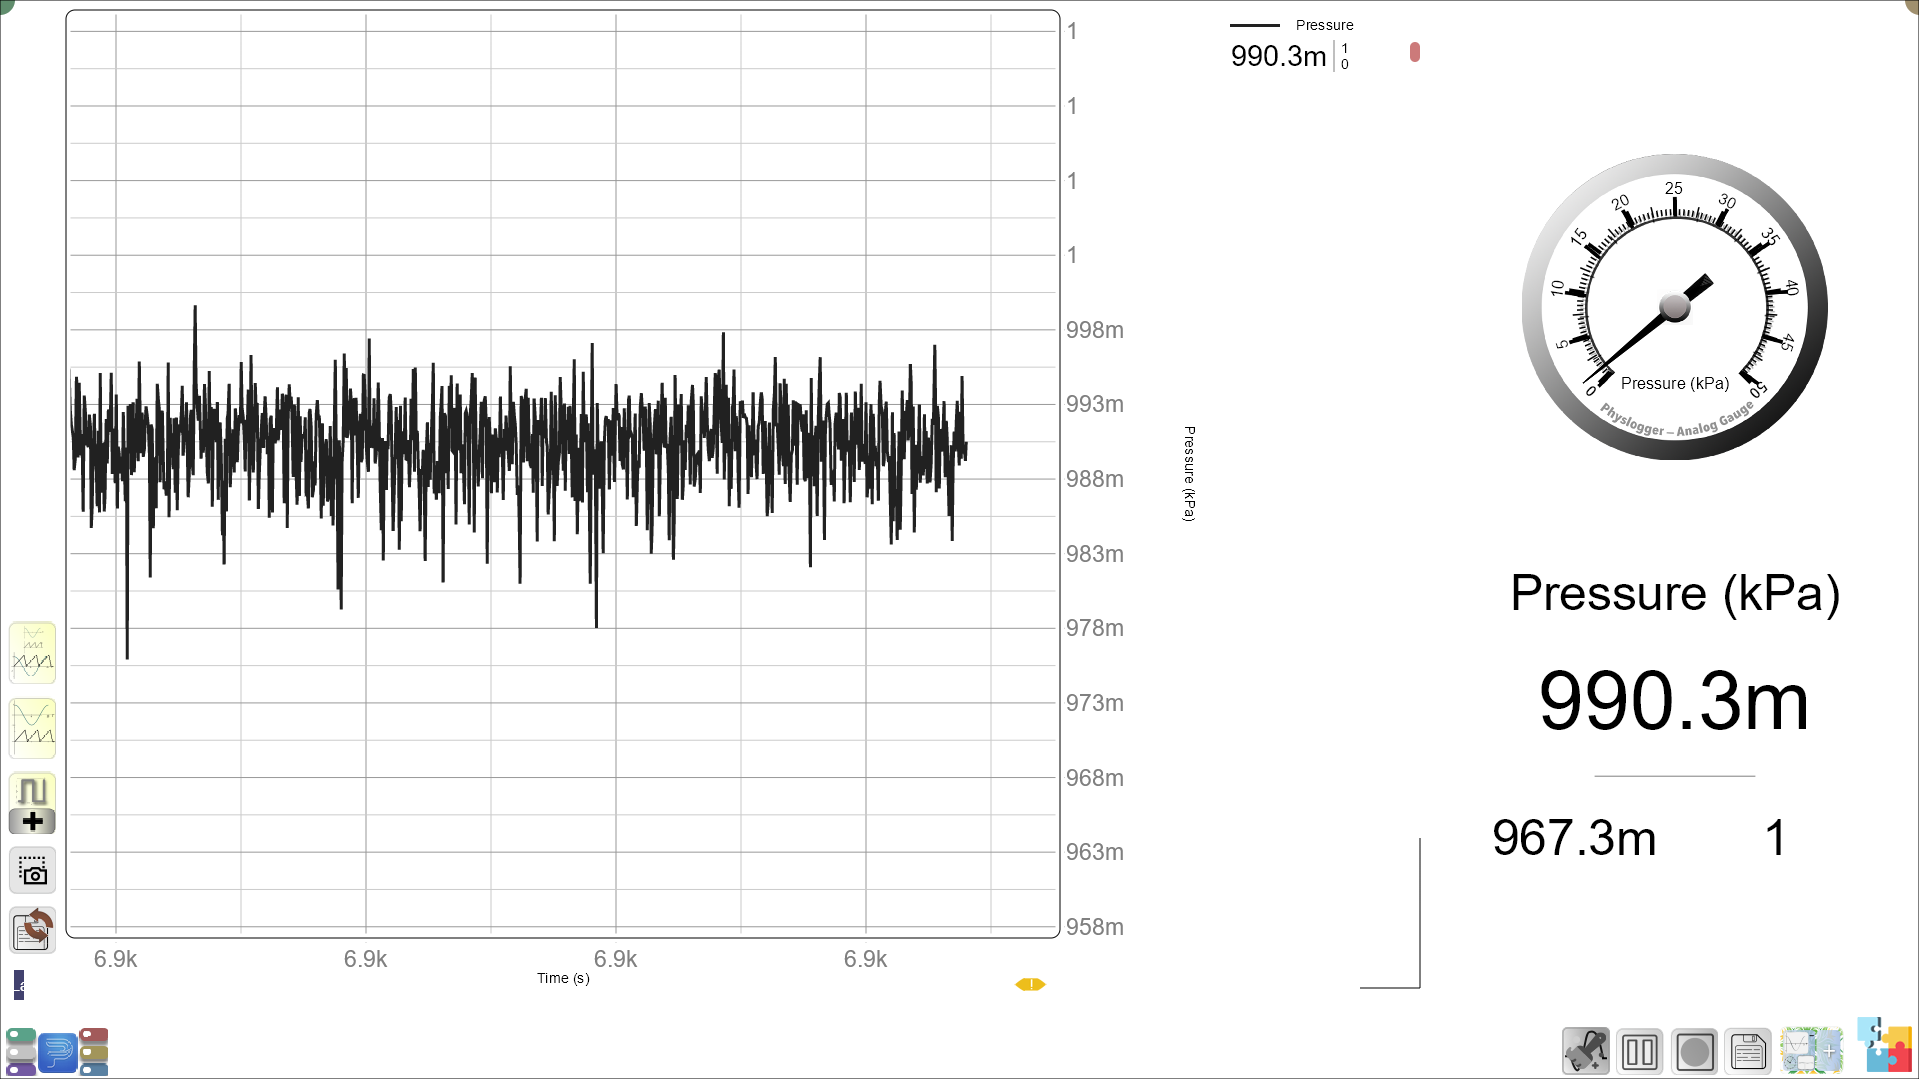
- Launch the Physlogger application and load the session file provided in the resources section.
Your setup will look something like this:
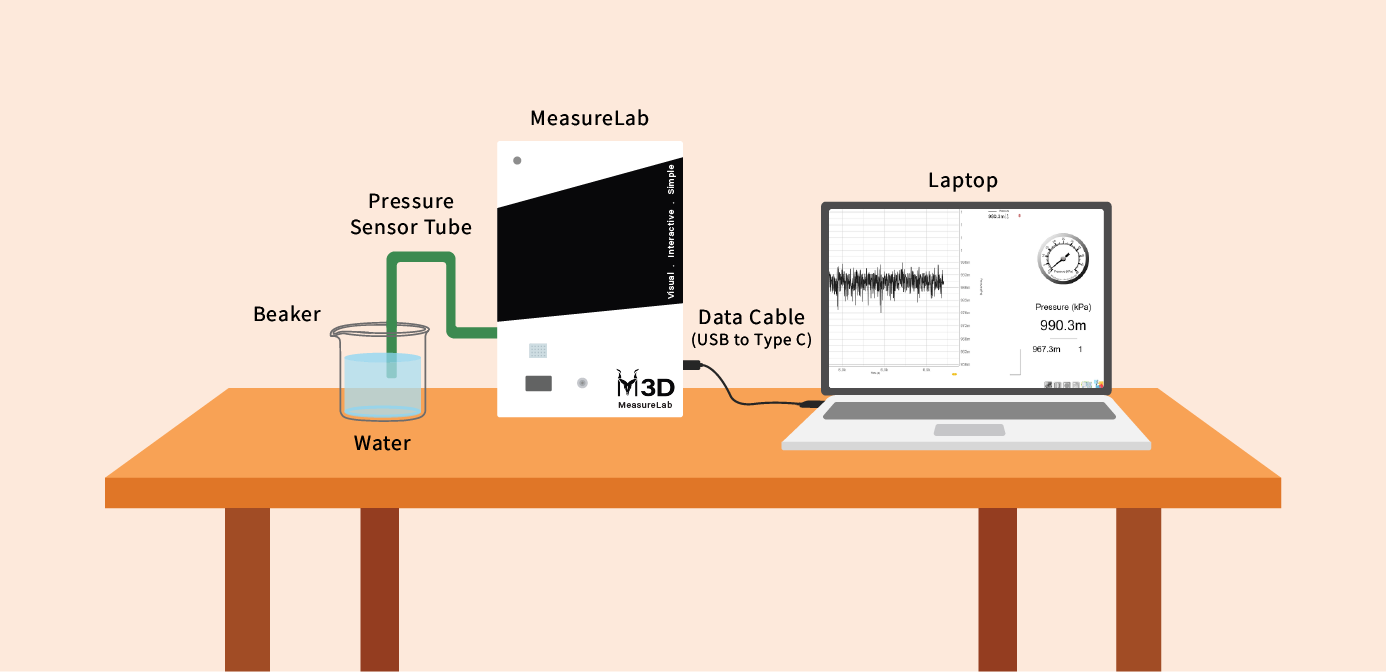
- Set up the apparatus as shown in the diagram above.
Introduction and Hands-On Exploration: (30-35 minutes)
-
Introducing Pressure as Particles Exerting Force:
-
You may start by asking:
“What do you think is inside air or water? Are they just empty spaces, or is there something in them?”
-
Guide students toward the idea of particles, explaining:
“Air and water are made of tiny particles, constantly moving around. Even though we can’t see them, these particles are always bouncing into each other and other things, including us!”
-
-
Understanding How Particles Create Pressure:
- You may say:
“Each time a particle bumps into something, it pushes a little bit, just like if you tapped someone on the shoulder. But when millions of particles push all at once, they create something we call pressure.”
- You may say:
-
Introducing Fluid Pressure with Depth:
-
You may ask:
“If I stack blocks, one on top of another, which block will be experiencing the most force?”
- Help students understand that the lowest block will experience the most force as it is has the weight of all the blocks above it.
-
You may say:
“Just like air, water is made of particles too. When we go deeper underwater, more water particles are above us, pressing down. This creates higher pressure.”
-
Follow-up Question:
“Why do you think people who dive very deep in the ocean need special equipment?”
-
Explain that as we go deeper, the pressure increases because there are more particles pressing down.
-
Setting Up the Experiment
Procedure
- Prepare the Pressure Sensor and Water Container:
- Attach the barometric pressure sensor to a tube that can be safely submerged.
- Place the container of water on a stable surface. The container should be deep enough to immerse the sensor at different levels.
-
Encouraging Predictions and Identifying Variables:
-
You may ask:
“What do you think will happen to the pressure reading as we lower the sensor deeper into the water? Will it increase, decrease, or stay the same?”
-
Guiding Question for Variables:
“In this experiment, what are we changing each time we take a new reading?”
- Help students recognize that they are changing the depth of the sensor.
And what are we measuring each time we change the depth?"
- Guide students to see that they are measuring the pressure each time they go to a new depth.
“Is there anything we need to keep the same each time we take a reading to make it a fair experiment?”
- Let students brainstorm ideas like keeping the type of fluid, container, and water temperature the same.
-
-
Starting the Experiment with MeasureLab:
- Begin by lowering the sensor into the water at various depths, recording the pressure readings at each level.
- You may say:
“As we immerse the sensor deeper, let’s watch the pressure readings. What pattern do you think we might see?”
Guided Reflection and Discussion: (15-20 minutes)
Recording Data and Creating a Scatter Plot
- Students should record their observations and data on a worksheet:
| Depth (cm) | Pressure (Pascal) | Observation (Increasing/Decreasing) |
|---|---|---|
| 0 (surface) | ||
| 5 | ||
| 10 | ||
| 15 | ||
| 20 | ||
| 25 |
- Creating a Scatter Plot:
- Once all data points are recorded, students can plot depth (x-axis) versus pressure (y-axis) on a scatter plot to visually see the trend.
- You may say:
“Let’s make a scatter plot with depth on the x-axis and pressure on the y-axis. This will help us see if there’s a pattern between how deep we go and the pressure.”
Discussion of Results and Identifying Trends
-
You may ask:
“Looking at your scatter plot, do you notice any trends or patterns as depth increases? Does the pressure go up, down, or stay the same?”
- You may explain:
“The scatter plot helps us see that as depth increases, pressure also increases. This shows that more particles pressing down creates higher pressure.”
- You may explain:
Follow-up Questions for Analysis
-
Relationship between Depth and Pressure:
-
You may ask:
“Can you describe the relationship between depth and pressure based on your scatter plot? Is it a strong or weak trend?”
-
Encourage students to describe how the plot shows a clear upward trend as depth increases.
-
-
Applying to Real-World Examples:
-
You may say:
“Knowing how depth affects pressure helps engineers design things like submarines and diving gear to handle high pressure. Why do you think it would be dangerous to go deep without strong equipment?”
-
You may ask:
“Can you think of other situations where pressure changes are important, like water tanks or deep-sea research?”
-
-
Reflecting on Variables:
- You may ask:
“Now that we’ve seen the results, can we review which part of the experiment was our independent variable, dependent variable, and what we kept the same?”
- You may ask:
Conclusion and Summary: (5 minutes)
-
Summarizing the Key Takeaways:
- You may say:
“Today, we learned that fluid pressure increases as we go deeper in water. Our scatter plot showed that the pressure went up with depth because there are more particles pressing down.”
- You may say:
-
Connecting to Real Life:
- You may explain:
“This understanding of fluid pressure helps us design safe equipment for deep-sea exploration and water storage tanks. The deeper we go, the more pressure there is to handle.”
- You may explain:
Glossary
- Fluid Pressure: The force exerted by particles in a liquid or gas per unit area.
- Depth: The distance below the surface of a fluid.
- Independent Variable: The variable we change in an experiment (here, the depth).
- Dependent Variable: The variable we measure in an experiment (here, the pressure).
- Controlled Variable: The variables we keep the same in an experiment to ensure accurate results (e.g., water temperature, container type).
- Scatter Plot: A graph that shows data points plotted along two axes to reveal a pattern or trend.