Grade 7 - Session 7: “Chilling Science: Salt and Ice”
Session Architect: Aleeza Ayaz - Markhor3D
Session Length: 50-60 minutes
Session Overview:
In this session, students will investigate how adding salt to ice affects its temperature. They’ll begin by learning about freezing and boiling points and how the movement of particles changes when substances freeze or melt. Through a fun and interactive example comparing their own body heat while running, students will intuitively grasp the link between particle motion and temperature. Using MeasureLab’s temperature sensor, they’ll observe and measure how salt lowers the temperature of ice. This hands-on experiment fosters curiosity and builds an understanding of heat transfer in everyday scenarios, like making ice cream or de-icing roads in winter.
Learning Objectives:
In this session, students will:
- Learn about freezing and boiling points and how particle motion relates to temperature.
- Predict what will happen to the temperature of ice when salt is added.
- Measure temperature changes using the temperature sensor connected to MeasureLab.
- Observe how salt causes ice to melt and lowers its temperature.
- Discover how melting absorbs heat, resulting in cooling.
Equipment Required:
- MeasureLab with a temperature sensor
- Two beakers or containers
- Ice cubes
- Salt (table salt or rock salt)
- Stirring rods
- Worksheet for predictions and observations
Teacher Resource:
Session File: ML77.plf (58.6 KB)
Teaching Aids:
- Projector (optional, for displaying live plots of temperature changes)
Preparation:
This step has to be done before the session on each workstation/apparatus by the teacher/session instructor:
- Make sure that each computer has Physlogger installed and can detect the Measrelab when connected to it using the provided cable.
- Each Measurelab should have access to a power outlet for sensors that require external power. This session uses Temperature Probe which requires external power source to be connected.
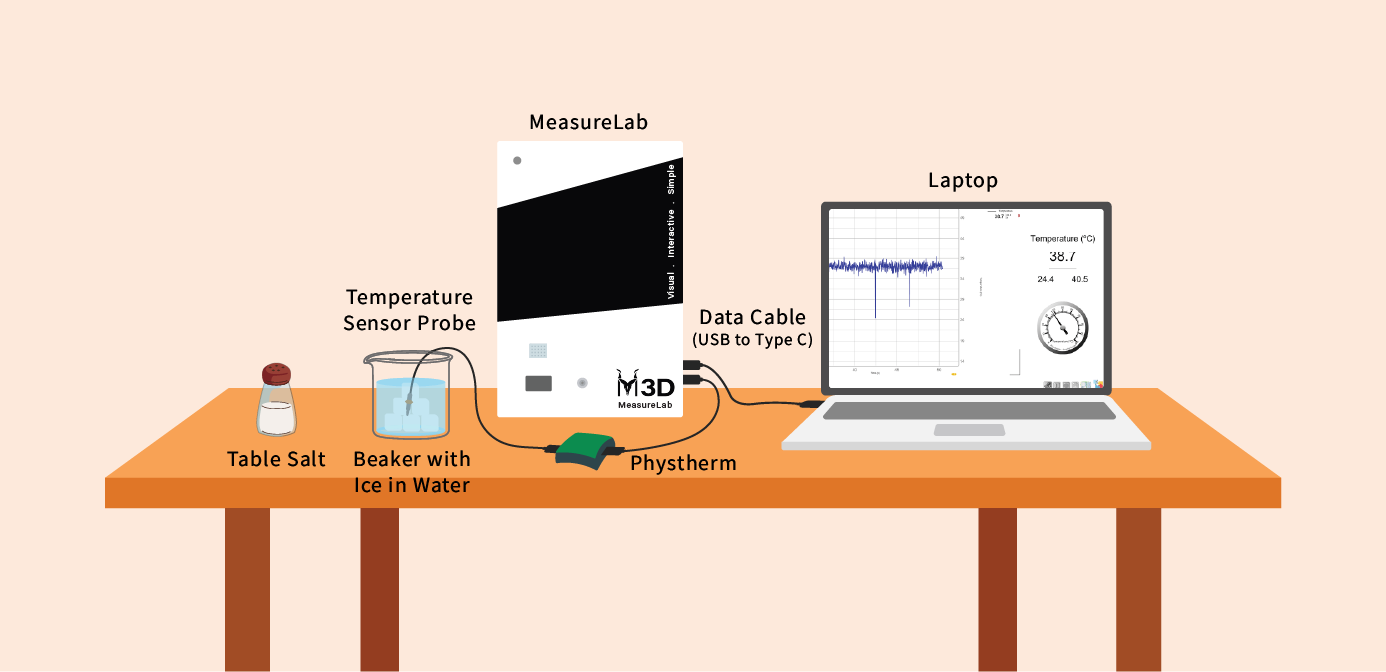
- Connect the Temperature Sensor to the Measurelab using the following port:

- Launch the Physlogger application and load the session file provided in the resources section.
Your setup will look something like this:
Introduction: (10-15 minutes)
Step 1: Engaging Students with Freezing and Boiling Points
- Ask:
“What happens when water turns into ice? Why does it freeze in the freezer?”
“What do you think happens to water when it boils? Why does it turn into steam?”
Step 2: Linking Particle Motion to Temperature
-
Interactive Demonstration:
- Ask a few students to pretend to “run in place” for 10 seconds to represent water particles moving quickly when it’s hot.
- Then, ask them to “freeze” and stand still, representing particles slowing down and forming bonds when water turns to ice.
-
Teacher Explanation:
“When particles move fast, like when you run, it’s like water at a high temperature—it feels hot. When particles slow down, like when you freeze, they stick together to make strong bonds, like ice forming in the freezer.”
Step 3: Introducing Temperature Measurement
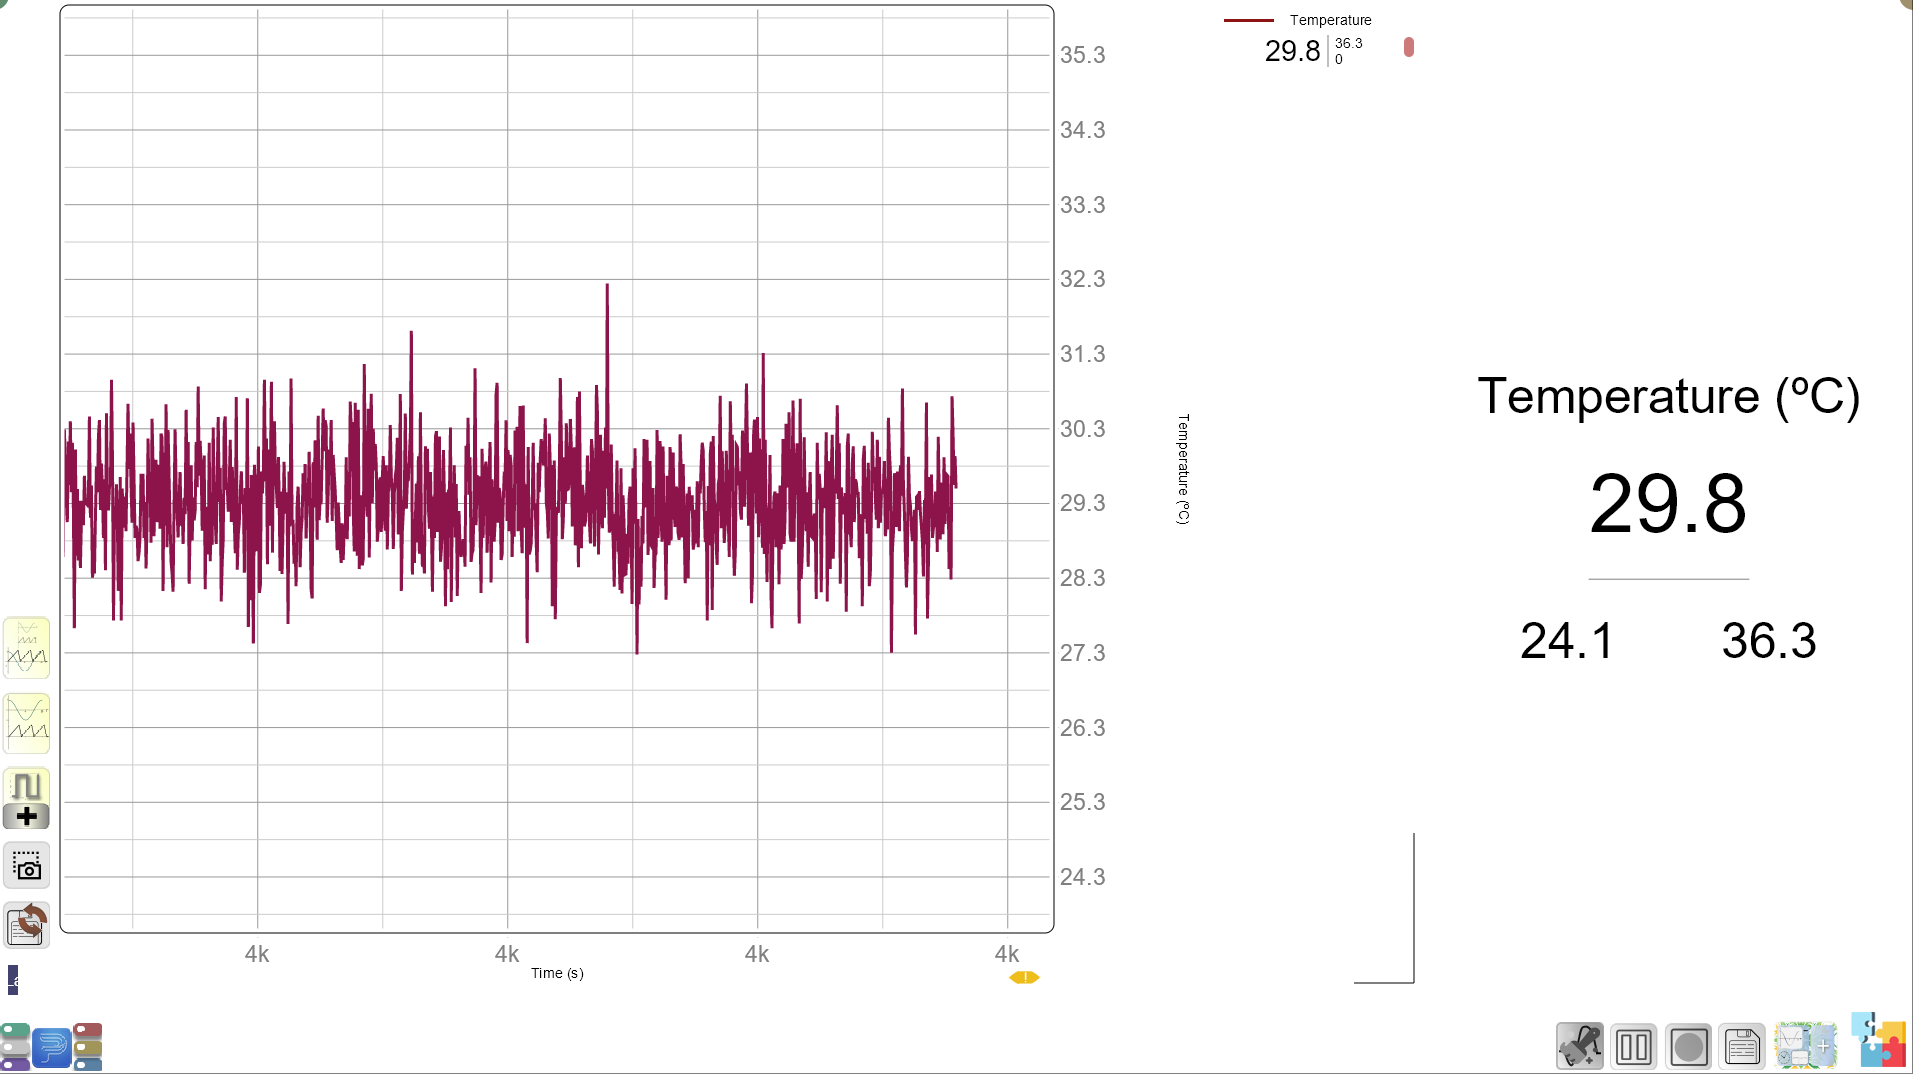
- Show the MeasureLab temperature sensor:
“This tool helps us see how hot or cold something is. Let’s test it on ice and warm water!”
- Demonstrate by placing the sensor in warm water and then in ice:
“See how the numbers on the screen go down when it’s in the ice? That’s the temperature dropping.”
Hands-On Exploration: (25-30 minutes)
Step 1: Measuring Initial Ice Temperature
- Setting Up:
- Distribute beakers with ice cubes to each group and give them a temperature sensor.
- Observation:
- Students will place the sensor in the ice and record the starting temperature on their worksheet.
Step 2: Predicting the Effect of Adding Salt
- Encouraging Predictions:
- Ask:
“What do you think will happen to the temperature if we add salt to the ice? Will it stay the same, go up, or go down?”
- Students will write their predictions in their worksheet.
Step 3: Adding Salt and Recording Temperature Changes
- Adding Salt:
- Students will add a spoonful of salt to their beaker and gently stir.
- Measuring Over Time:
- Students will record the temperature every minute for five minutes using the temperature sensor.
- Teacher Prompt:
“Watch how the temperature changes each minute. Write it down in your table, and we’ll plot the numbers on a graph.”
- Recording Results:
- Students will write down each reading in their worksheet’s data table.
Guided Analysis: Plotting and Interpreting the Graph (15 minutes)
Step 1: Creating the Graph
- Worksheet Setup:
- Each group will have a worksheet with pre-drawn axes:
- X-axis: Time in minutes
- Y-axis: Temperature in °C
- Plotting Data:
- Students will plot their temperature readings on the graph, connecting the points with a line.
Step 2: Interpreting the Graph
- Teacher-Led Questions:
- “What do you notice about the line on the graph? Is it going up or down?”
- “How quickly did the temperature drop after adding the salt?”
- “Was the temperature change steady, or did it slow down over time?”
Step 3: Explaining the Science
- Explain in Simple Terms:
“Salt makes the ice melt, but melting needs heat. The ice takes heat from its surroundings to melt, which makes the temperature drop even more!”
- Real-Life Connection:
“This is why people sprinkle salt on icy roads—it melts the ice and makes the road safer. It’s also why salt is used to make ice cream—it keeps the mixture cold while it freezes!”
Worksheet Activity:
Data Table:
| Time (Minutes) | Temperature (°C) |
|---|---|
| 0 (Start) | _________________ |
| 1 | _________________ |
| 2 | _________________ |
| 3 | _________________ |
| 4 | _________________ |
| 5 | _________________ |
Graphing Section:
- Students will use their data to create a graph.
Reflection Section:
- “What did you notice about the temperature change after adding salt?”
- “Why do you think the temperature dropped more with salt than without it?”
Summary and Reflection (5-10 minutes)
Summarizing the Key Idea:
- “Today, we saw that adding salt to ice lowers its temperature because melting needs heat, and the ice takes that heat from the surroundings.”
Reflection Questions:
- “What did your graph show about how the temperature changed over time?”
- “Can you think of other ways we use this idea, like making ice cream or keeping drinks cold?”
Glossary:
- Freezing Point: The temperature at which a liquid turns into a solid (0°C for water).
- Melting: The process of turning a solid into a liquid by adding heat.
- Temperature: A measure of how hot or cold something is.
- Graph: A picture that shows how things change over time.