Grade 8 - Session 4: “Air Expansion and Heat”
Session Architect: Aleeza Ayaz - Markhor3D
Session Length: 50-60 minutes
Learning Objectives:
In this session, students will:
- Measure how temperature affects pressure in a sealed container using sensors.
- Learn how to calculate moles using the Ideal Gas Law formula.
- Understand which quantities in the Ideal Gas Law are directly and inversely proportional.
- Explore how gases expand when heated and contract when cooled, linking the changes in temperature and pressure.
- Analyze experimental data using graphs to observe relationships between pressure, temperature, and moles.
Teacher Resource:
Session File: ML84.plf (57.6 KB)
Equipment Required:
- PC/Laptop to display measurement and live plot
- MeasureLab with built-in pressure sensor and temperature sensor.
- A sealed container (strong glass or plastic beaker with a lid).
- Hot water bath and cold water bath.
- Timer or stopwatch.
- Worksheet for recording observations and calculations.
- Pens, pencils, markers, etc.
Preparation:
This step has to be done before the session on each workstation/apparatus by the teacher/session instructor:
- Make sure that each computer has Physlogger installed and can detect the Measrelab when connected to it using the provided cable.
- Each Measurelab should have access to a power outlet for sensors that require external power. For this session, Temperature Sensor Probe and the built-in Pressure Sensor will be used which require an external power source.
- Connect the Temperature Sensor to the Measurelab using the following port:

- Launch the Physlogger application and load the session file provided in the resources section.
Your setup will look something like this:
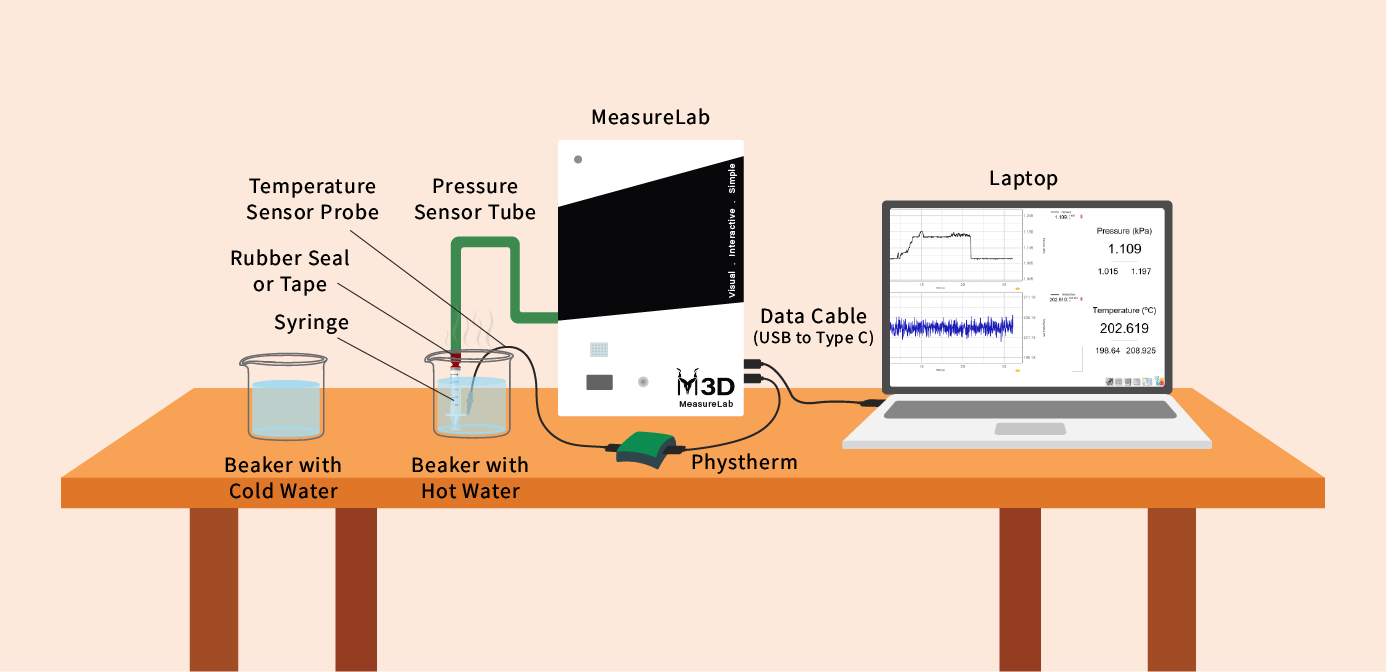
- Set up the apparatus as shown in the diagram above.
Introduction and Hands-On Exploration: (35-40 minutes)
Starting with an Engaging Question:
- You may start by asking:
“Have you ever noticed that a balloon left in the sun gets bigger, or that it explodes? What do you think is happening inside the balloon?”
- Let students share their thoughts. Don’t explain too much yet—this question will set the stage for them to learn through the experiment.
Set Up the Experiment with the Ideal Gas Law:
Introducing the Equipment:
- Explain that students will use a sealed container with air inside. The container will be placed in hot and cold water baths to heat and cool the air.
- The pressure sensor will measure the air pressure inside, and the temperature sensor will track how hot or cold the air gets.
Introduce the Ideal Gas Law Formula:
You may say:
“We’ll use the Ideal Gas Law to help us understand what’s happening. The formula is:
PV = nRT
Where:
- P is pressure,
- V is volume,
- n is the number of moles,
- R is a constant (you don’t need to worry about this for now),
- T is temperature.”
Predictions:
- You may ask:
“What do you think will happen to the pressure inside the container when we put it in hot water? What about when we put it in cold water?”
- Students should write their predictions on the worksheet.
Running the Experiment:
Hot Water Bath:
- Place the sealed container in the hot water bath.
- You may ask:
“Look at the live plot. Is the pressure going up or down? Why do you think that is happening?”
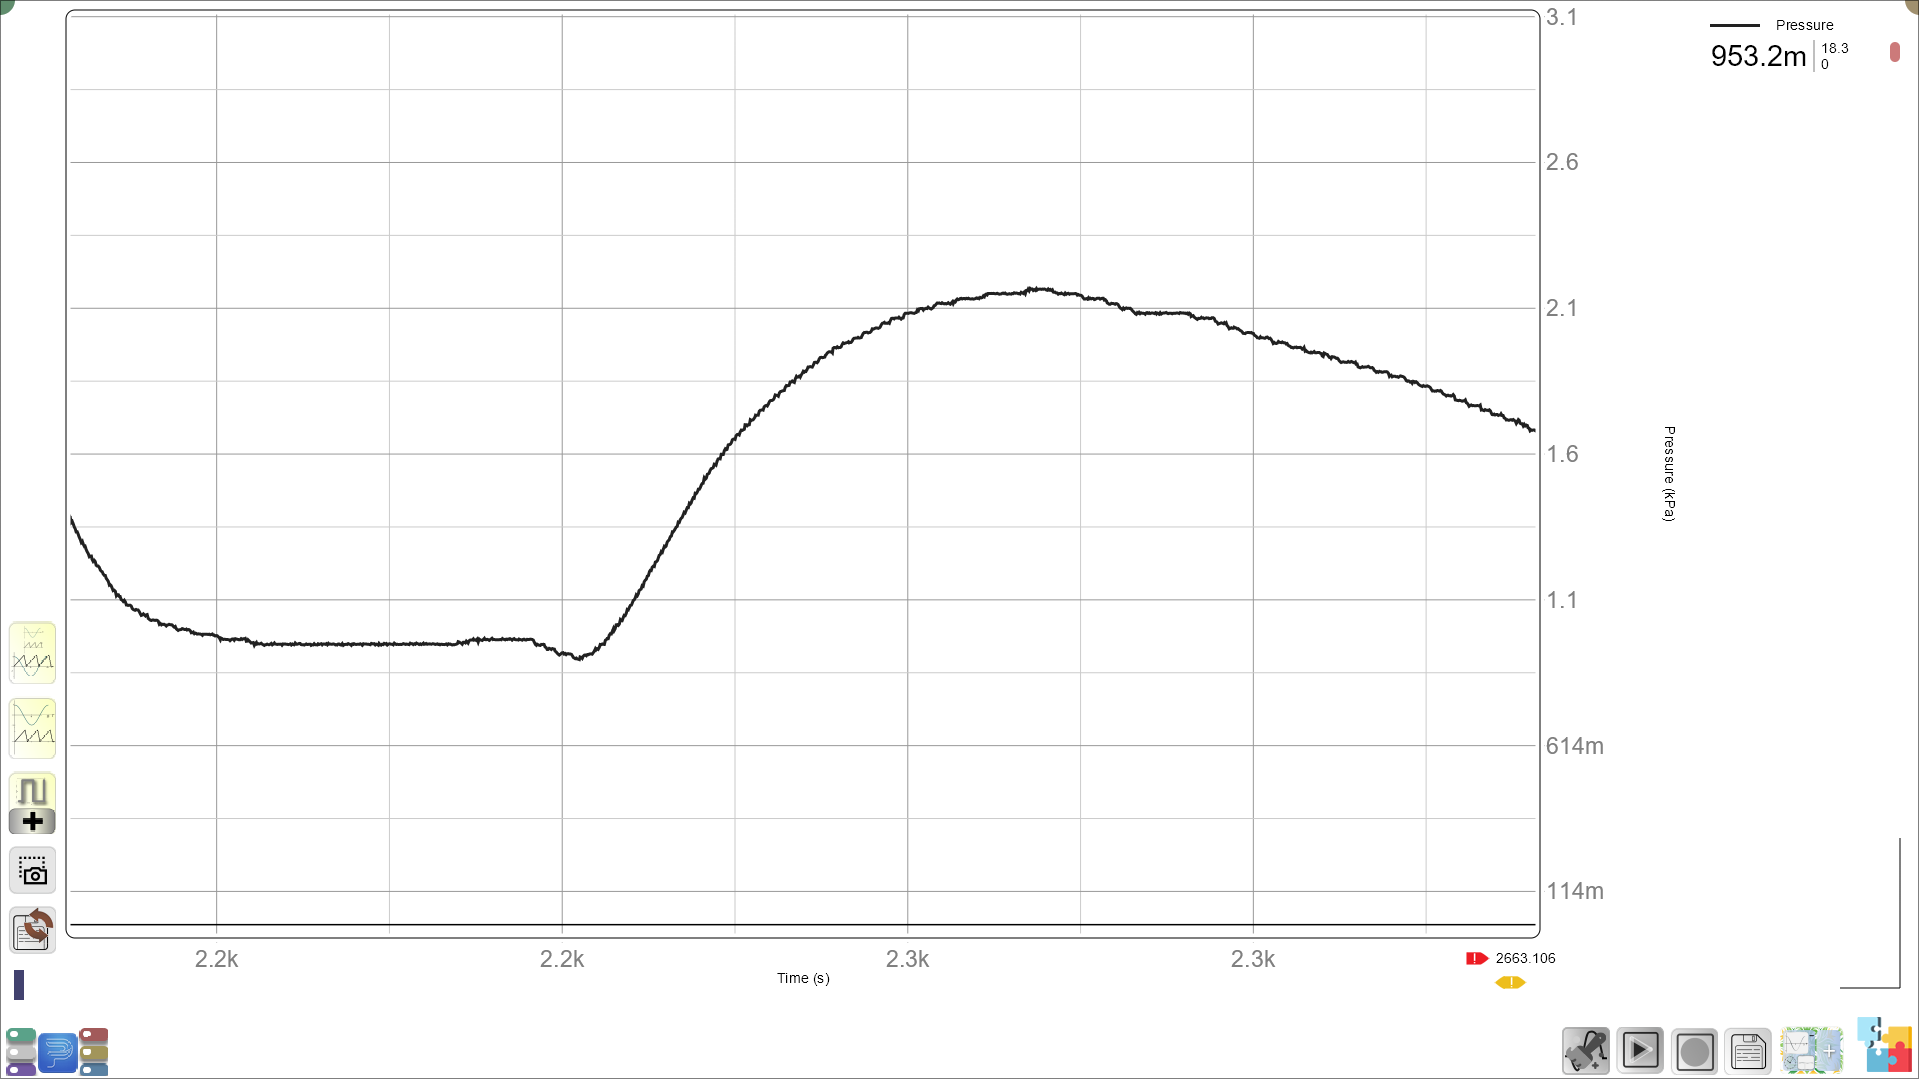
- Let students observe the pressure increase in real-time as the temperature rises. They should record the initial pressure and temperature, and the pressure and temperature after 5 minutes.
Cold Water Bath:
- After heating, quickly move the container to the cold water bath.
- You may ask:
“Now that we’ve moved the container to the cold water, what do you think will happen to the pressure?”
- Allow students to observe the pressure drop and have them record the final pressure and temperature.
Building Understanding Through Observation
- You may ask:
“What did you notice about the pressure when we increased the temperature? Why do you think the pressure went up?”
-
Let students explain that higher temperature causes air particles to move faster, hitting the container walls harder, which increases pressure.
-
You may then ask:
“And what happened when we cooled the air down? Did the pressure go up or down?”
- Students should explain that cooling the air slows down the particles, reducing pressure.
Introducing and Calculating Moles:
Now, bring in the concept of moles:
-
Explain that the air inside the container is made up of tiny particles. The number of these particles is represented by moles (n) in the Ideal Gas Law formula.
-
You may say:
“The more moles of gas (particles) there are in the container, the more pressure they create because more particles are bouncing off the walls.”
Moles Calculation:
Explain that we can calculate the number of moles using the rearranged Ideal Gas Law:
n = PV/RT
Since we keep the volume (V) constant and know the values for P, R, and T, they can now calculate the number of moles of air at different temperatures and pressures.
Moles Calculation Example:
Have students plug in the recorded pressure and temperature from the experiment to calculate moles (n).
Worksheet Table for Data:
| Condition | Pressure (P) | Temperature (T) | Number of Moles (n) |
|---|---|---|---|
| Hot Water Bath | |||
| Cold Water Bath |
Understanding Proportionality:
Once students have filled out their data, discuss the direct and inverse relationships in the Ideal Gas Law:
- You may ask:
“Looking at your data, what happens to pressure when temperature increases? Is the relationship direct or inverse?”
-
Let students recognize that pressure and temperature are directly proportional when volume is kept constant.
-
You may also ask:
“If we added more gas into the container, what would happen to the pressure?”
- Guide students to understand that pressure would increase, which shows a direct relationship between pressure and the number of moles (n).
Graphing the Data: (15 minutes):
Plotting Pressure vs. Temperature:
Students will create a graph with temperature on the x-axis and pressure on the y-axis.
- You may ask:
“What does the graph show about the relationship between temperature and pressure? Is it a straight line or a curve?”
- They should conclude that the graph shows a linear or direct relationship between temperature and pressure.
Conclusion and Summary: (5-10 minutes):
- You may summarize:
“Today, we saw that heating air makes it expand, which increases pressure because the air particles are moving faster. We used the Ideal Gas Law to calculate the number of moles and learned how pressure, volume, temperature, and moles are all related.”
- You may wrap up with a real-life connection:
“Next time you see a hot air balloon rising or use a pressure cooker, think about how the air inside is expanding or contracting depending on the temperature!”
Glossary:
- Pressure: The force that particles in a gas exert on the walls of a container.
- Temperature: A measure of how hot or cold something is, related to particle speed.
- Moles: A measure of the number of particles in a substance.
- Ideal Gas Law: A formula that describes the relationship between pressure, volume, temperature, and moles.
- Direct Proportionality: When one variable increases, the other increases.
- Inverse Proportionality: When one variable increases, the other decreases.