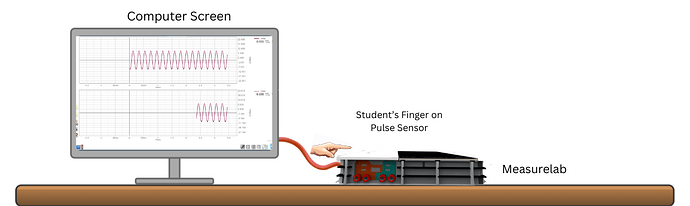
Pulse Sensor:
When you use the pulse sensor, you can see the pulses on the Live Plot as well as your heart rate on the side in BPM. This reading can sometimes be a bit off. Some possible sources of error are:
- Too much movement: While measuring your heart rate, you should stay still. Any movement in your body and especially the finger you have placed on the sensor can cause the measurement to spike and produce inaccurate results.
- Bright source of light: Since the sensor works on light, if there is a bright source of light nearby, it could affect your readings. Normal room lights should have minimal to no effect on the readings.
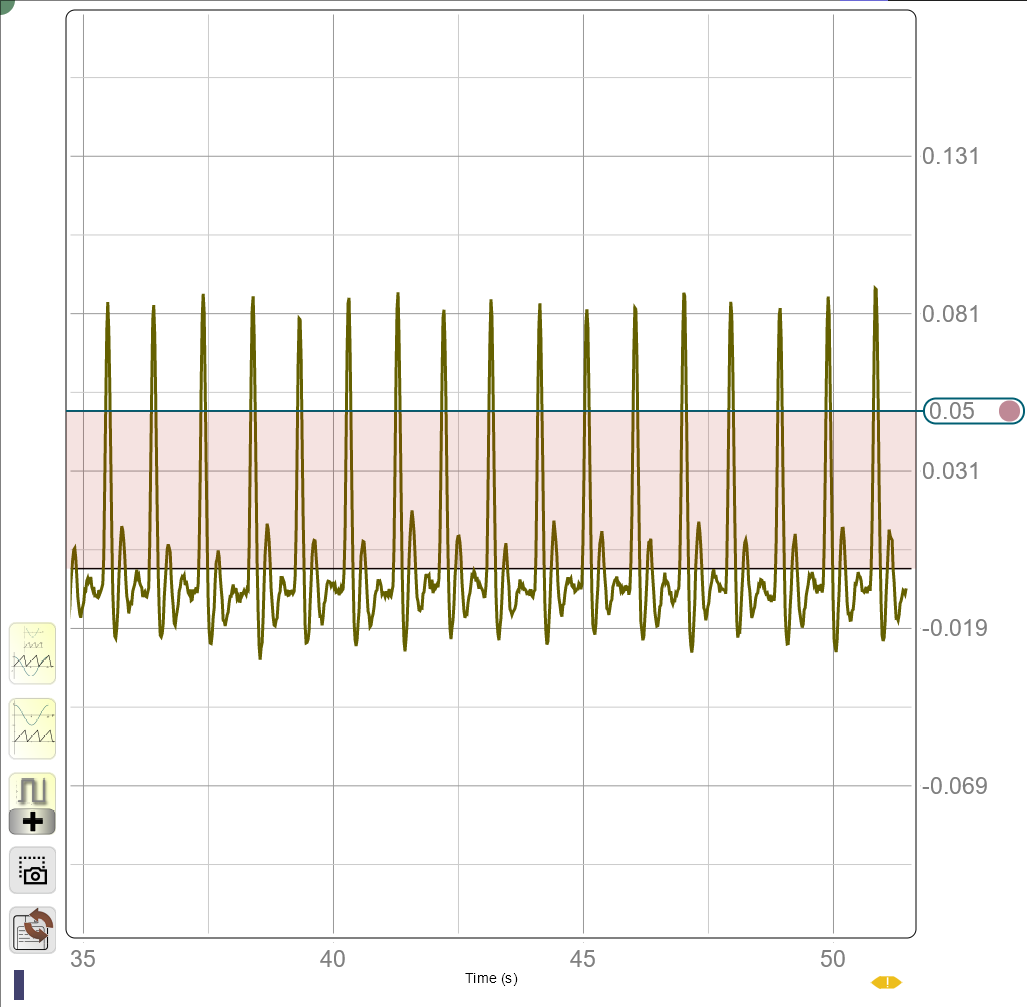
- Height of Pulses: The pulses you see on the screen reach a certain height for different individuals depending on how strong the reading is which depends on multiple factors. The widget on the side which calculates and tell you your heart rate in BPM counts these pulses. It only counts specific pulses, which are above a certain value. That value is knows as threshold value. In the lesson plans, this value is set at 0.05.
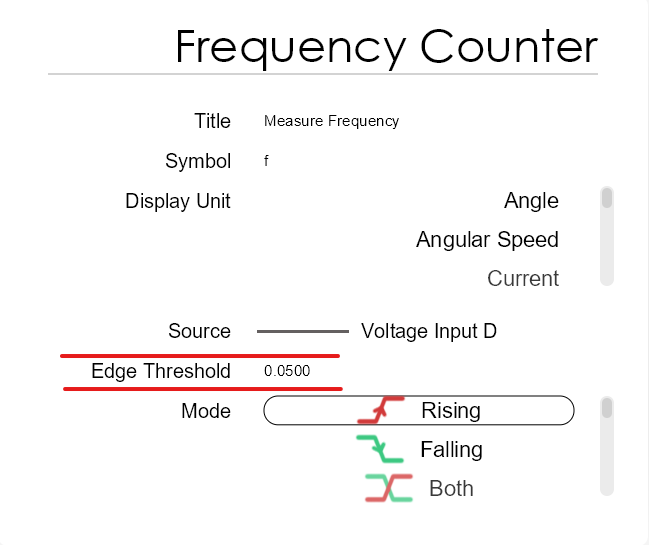
If the majority of the pulses in your data are below this threshold value, you will not get an accurate reading. You can change this value simply by looking at your pulses and choosing a threshold value that covers most of the pulses. You can do so by going to the Quantities Menu and clicking the Measure Frequency quantity.
An easy and visual way to choose the correct threshold value is to place a marker that is is large enough that it doesn’t count the smaller fluctuations but small enough that it doesn’t miss any of the pulses.
If you don’t know how to place a maker on the Live Plot, you can go through the Introduction to Live Plot UI Guide.