Introduction to Live Plot UI:
Let’s start with exploring the different elements of the live plot environment and tools that can help us understand the plot better.
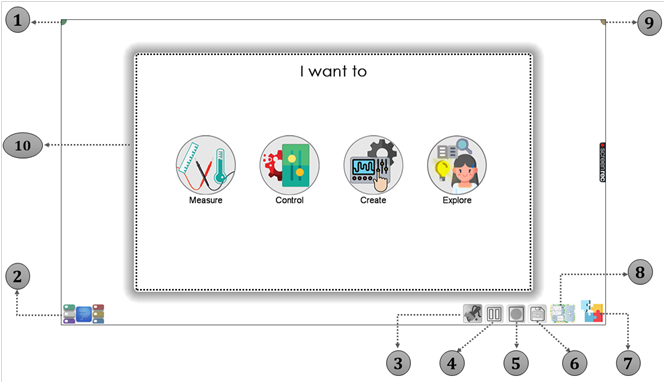
1. Basic Interface:
| No. | Icon and It’s Description |
|---|---|
| 1 | Help: The help button shows the most relevant help according to the content shown on the screen. It may include help topics as well as tutorials that walk you through example processes. |
| 2 | Quantities Menu/Panel: View and edit all the hardware, software, and measurable quantities. |
| 3 | Clear Data: Clear all the recorded data in all the LivePlots in the workspace. |
| 4 | Play/Pause: Pauses or resumes the time quantity on the PhysLogger Desktop App. Time will keep running on the MeasureLab hardware while paused. |
| 5 | Record Data: This option can be found with every column whether it is of user controllable quantity or sensor data. |
| 6 | Save Data: Save the recorded data in the LivePlots and the manual data entry tables present on the current page on the workspace. |
| 7 | Extensions Menu: Extends the workspace using guided tours and by adding quantities and widgets. |
| 8 | Add a new page to workspace |
| 9 | Options: With this option button, you can change preferences, save workspace using files, and shut down the PhysLogger Desktop App. To see the options window. |
| 10 | Self-guided tour of the screen: Launching the app and selecting “PhysLogger” automatically open the self-guided tour of the screen. |
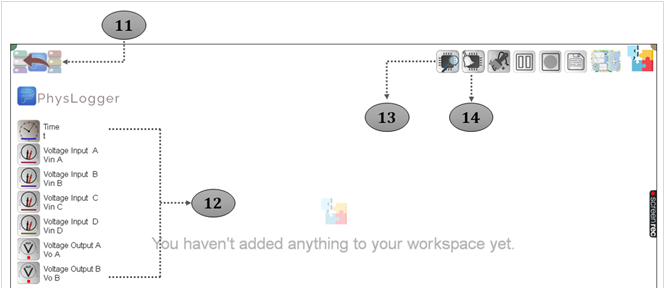
2. Quantities Menu:
The Quantities menu is available in the left bottom corner marked no.2 in the figure before.
| No. | Icon and It’s Description |
|---|---|
| 11 | To go back to the workspace from Quantities Panel |
| 12 | Basic Quantities in PhysLogger Desktop App. |
| 13 | Scan the bus: Scans the MeasureLab for changes. Add devices that have been physically connected and remove those which have been unplugged. |
| 14 | Clean the session: Clears the workspace and any configuration done on PhysLogger App. |
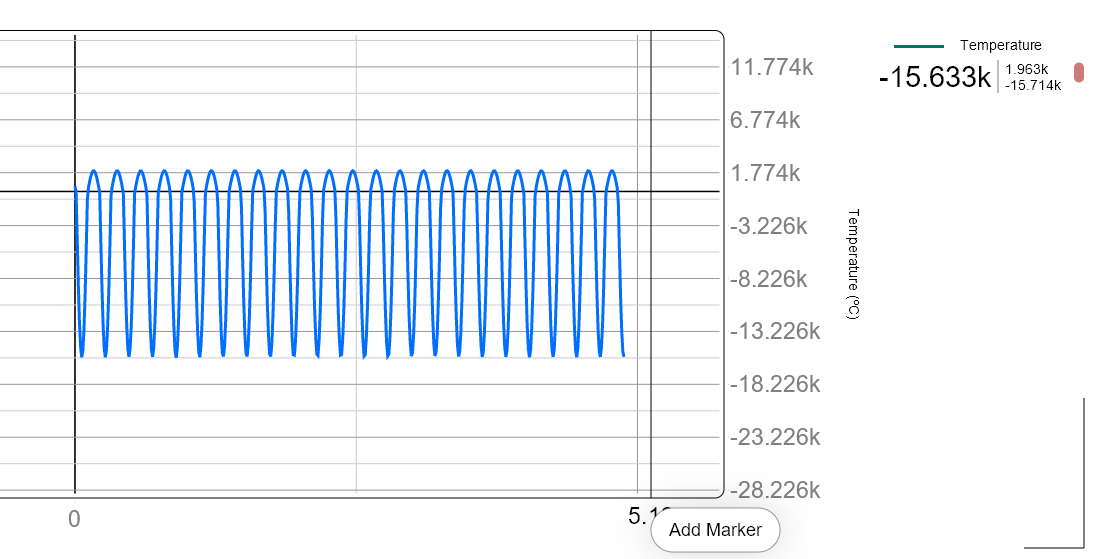
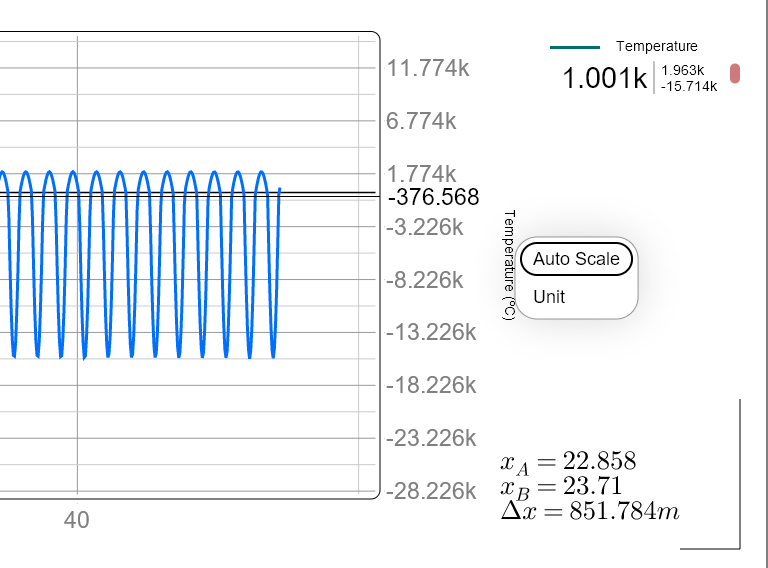
3. Adding Markers:
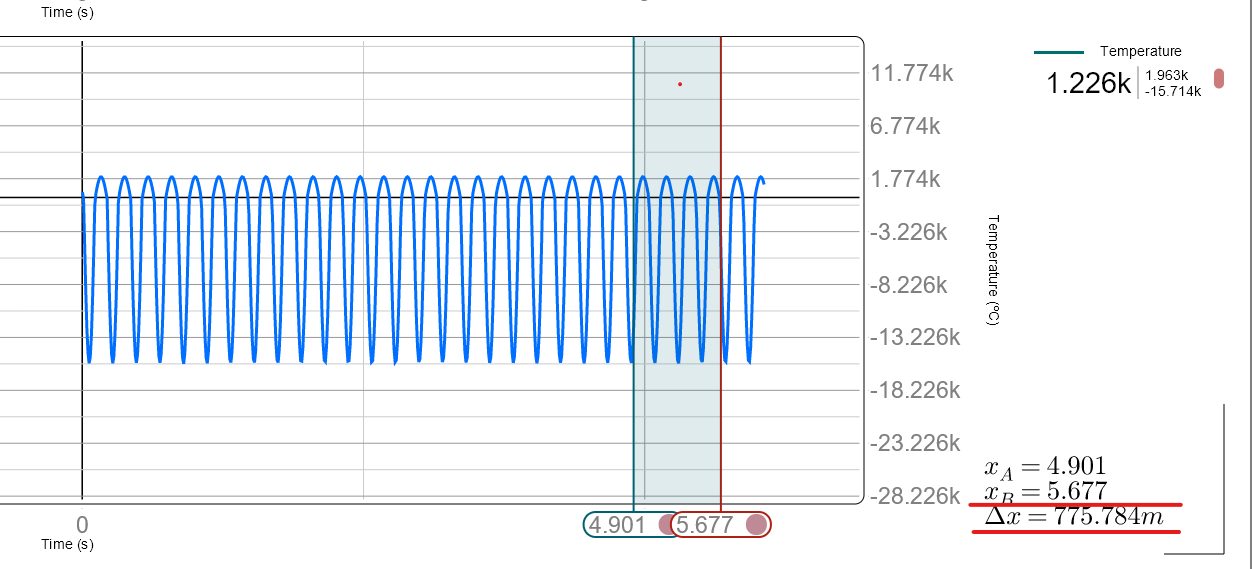
You can use markers on your live plot at any point to calculate the difference of values between those points. Markers can be placed by clicking at the point on the respective axis(either x or y).
By adding two points, you can get the difference which will appear on the bottom right side:
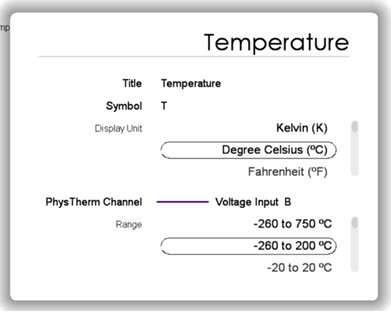
4. Quantity Properties:
PhysLogger Desktop allows the display title and symbols of all and units of some quantities to be modified. This can be done by opening the property box of the quantity from the Quantities.
Method of changing the units of a PhysLogger quantity being plotted:
- Shifting temperature unit by right clicking the quantity name on LivePlot axis.
- The property box of temperature which appears when we click Quantities Panel > Temperature.
5. Using Measurelab Display:
To use the Built-in Display on MeasureLab console, click on the quantities menu:
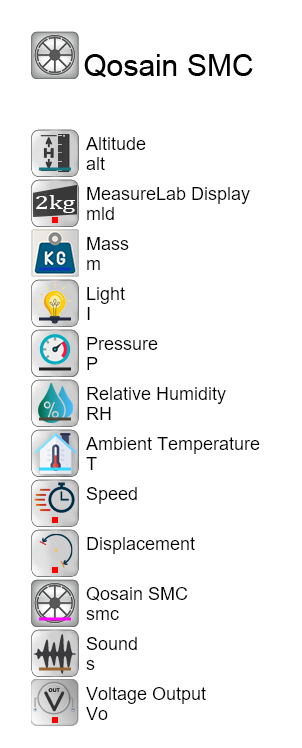
The second button in the list named “MeasureLab Display” can be used to control what value is shown on the display.
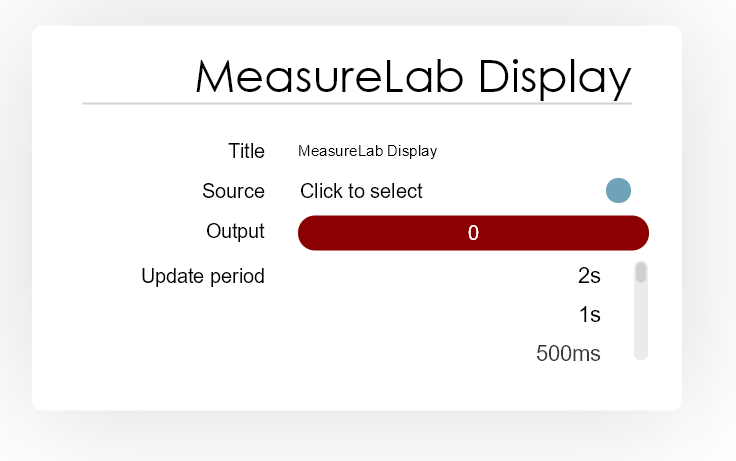
| Button Name | Action |
|---|---|
| Source | Source menu is used to select the value to be displayed on the screen. Clicking on it will open a list of available quantities to choose from. |
| Output | This button acts as an ON/OFF switch for the display. 0 corresponds to OFF state and 1 corresponds to ON state |
| Update Period | Update period decides how often the value is refreshed on the screen. |
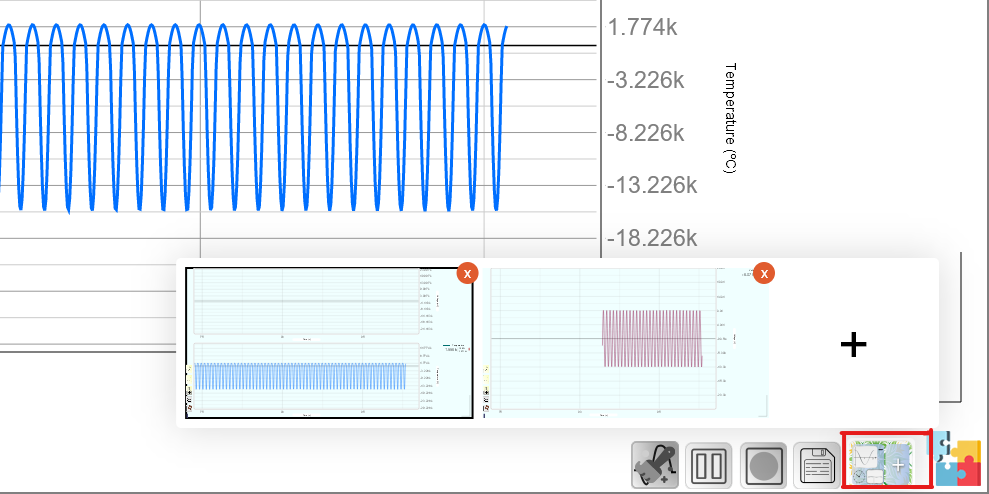
6. Workspaces:
You can have multiple workspaces in PhysLogger Desktop which allows you to plot different values or the same quantities but with different preferences e.g. unit, range etc. at the same time.
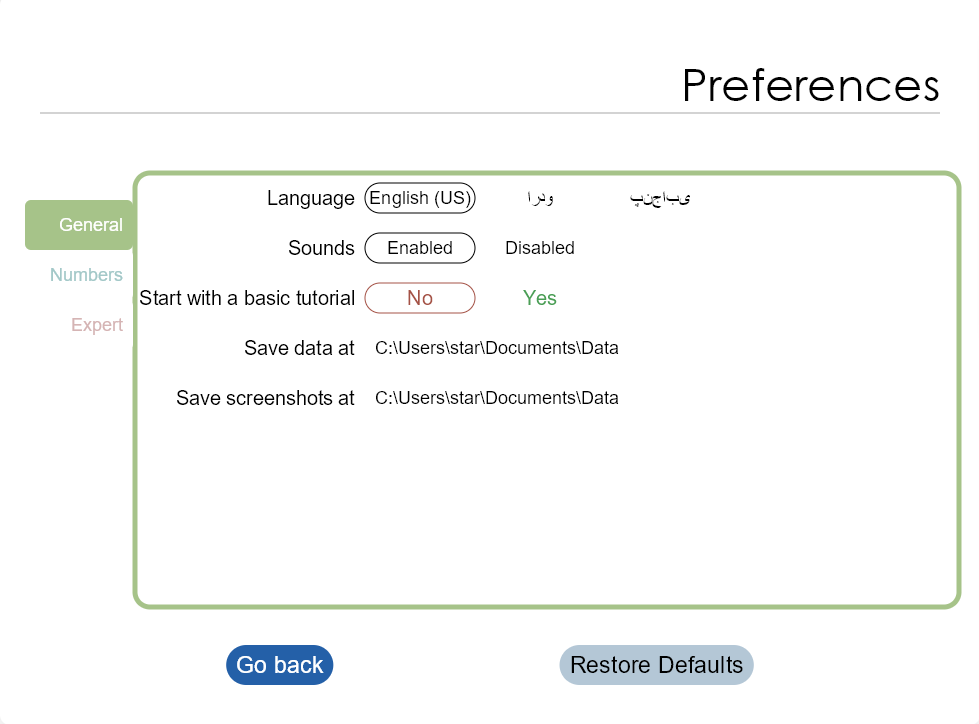
7. Setting General Preferences:
Use the general preferences page to configure some basic options such as the preferred language, audio mode, default save location, etc.
To access this page, go [Options] > [Preferences] > [General].
- Language: PhysLogger Desktop is currently available in English, Urdu, and Punjabi. From this list, select the language you would like PhysLogger to interact with you in.
- Sounds: PhysLogger Desktop includes some sound effects integrated into its software. These sounds play when some buttons are clicked and some operations are completed. The audio can be enabled or disabled based on your choice.
- Start with a basic tutorial: This tutorial guides you through a series of wizards and tours to familiarize you with the layout, general working, and usage of PhysLogger Desktop. If enabled, the application will always launch with this tutorial.
- Save data at: You may choose the default location where your data files (in .csv format) will be stored on the PC. Before defining a default save location, ensure that you have access rights to that directory.
- Save screenshots at: PhysLogger Desktop allows users to directly take screenshots from the workspace. The default save location for these screenshots can be set in General Preferences.
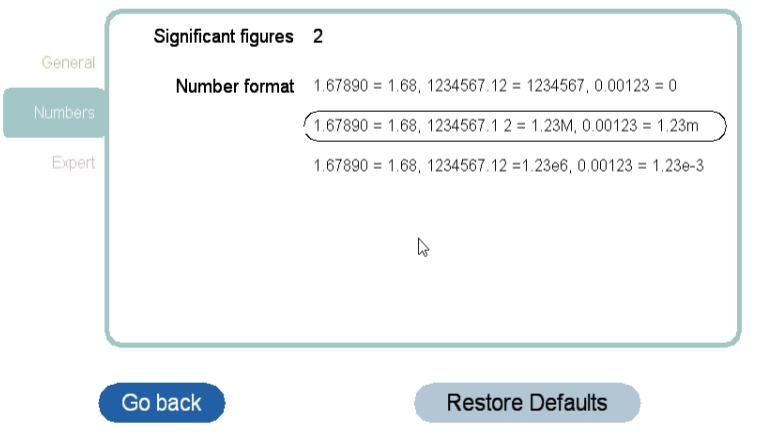
8. Adjusting Number Formats:
Use the numbers preference page to specify the number of significant figures and exponent format for all your displayed, collected, and exported readings.
- Go to [Options] > [Preferences] > [Numbers].
- Specify the desired number format for your readings.
- All readings will follow the rounding method of mathematics to adjust according to your specified significant figures.
- The desired display of exponents, prefixes, and decimals can also be set in this menu.
Keep in Mind! Once chosen, all your measurement data, live plot readings, and numbers will be driven by these settings. The displayed and saved data will try to take these preferences as governing rules.
Note: Prefixes in exported data may not be directly readable as a mathematical expression in third-party software. For example, MS Excel may interpret 1M as an alphanumeric entry instead of 1e06. So, it is advised to use other formats while exporting data or the exported file be processed manually to replace suffixes with numbers.
—---------------------------------------------------------------------------------------------------------------
For a video demonstration of how to set up and use Measurelab, you can watch the attached Youtube video.