Grade 3 – “Wind Power Play: Exploring Fan Speed and Variables
Architect: Aleeza Ayaz - Markhor3D
Session Length: 50-60 minutes
Session Overview:
In this session, students will be introduced to the concept of voltage and explore how it affects the speed of a fan. They will experiment with changing voltage (independent variable) and observe how it impacts the fan speed (dependent variable), introducing them to the concept of variables in a scientific experiment. Through hands-on activities, live data visualization, and structured observations, students will begin to understand cause-and-effect relationships while developing an appreciation for how adjustments in one factor can influence another. This session encourages curiosity and critical thinking while laying a foundation for understanding voltage and its effects.
Learning Objectives:
In this session, students will:
- Familiarize themselves with MeasureLab by adjusting the voltage to control fan speed.
- Understand and focus on the relationship between the independent variable (voltage) and the dependent variable (fan speed) through hands-on exploration.
- Practice basic data collection by adjusting voltage values, observing changes, and noting down follow-up questions.
- Begin interpreting live plots, focusing on how voltage changes affect fan speed in real-time.
Equipment Required:
- MeasureLab with motor control connected to a small fan.
- A laptop or PC for displaying live plots and adjusting voltage to control fan speed.
- One lightweight object (e.g., a piece of paper or cotton ball) to observe the impact of air movement (keep this constant).
- Worksheet for students to record their observations and answers to follow-up questions.
Teaching Aids:
- Projector (optional, for displaying live plots and motor speed adjustments).
- Whiteboard to explain the basic concepts of independent and dependent variables.
Teacher Resource:
Session File: ML32.plf (58.2 KB)
Preparation:
This step has to be done before the session on each workstation/apparatus by the teacher/session instructor:
- Make sure that each computer has Physlogger installed and can detect the Measrelab when connected to it using the provided cable.
- Each Measurelab should have access to a power outlet for sensors that require external power.
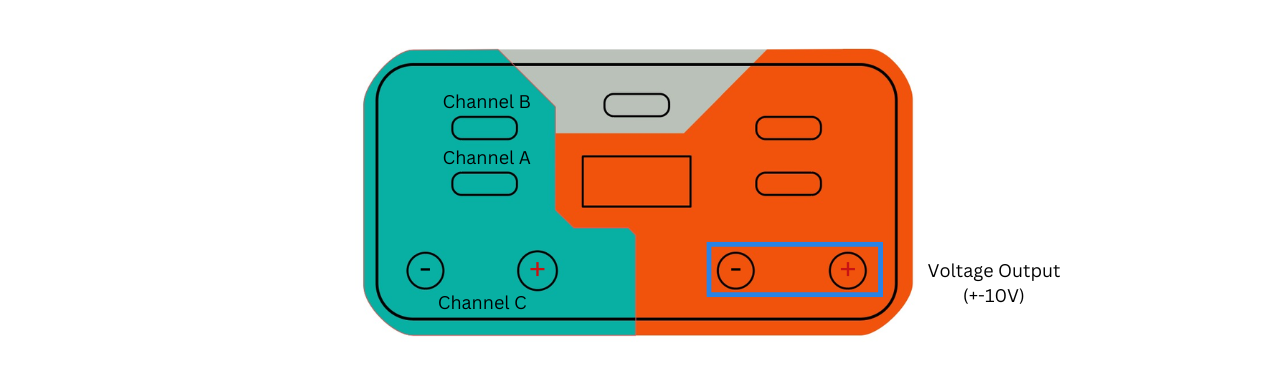
- Connect the Fan attachment to the Measurelab using the following port:
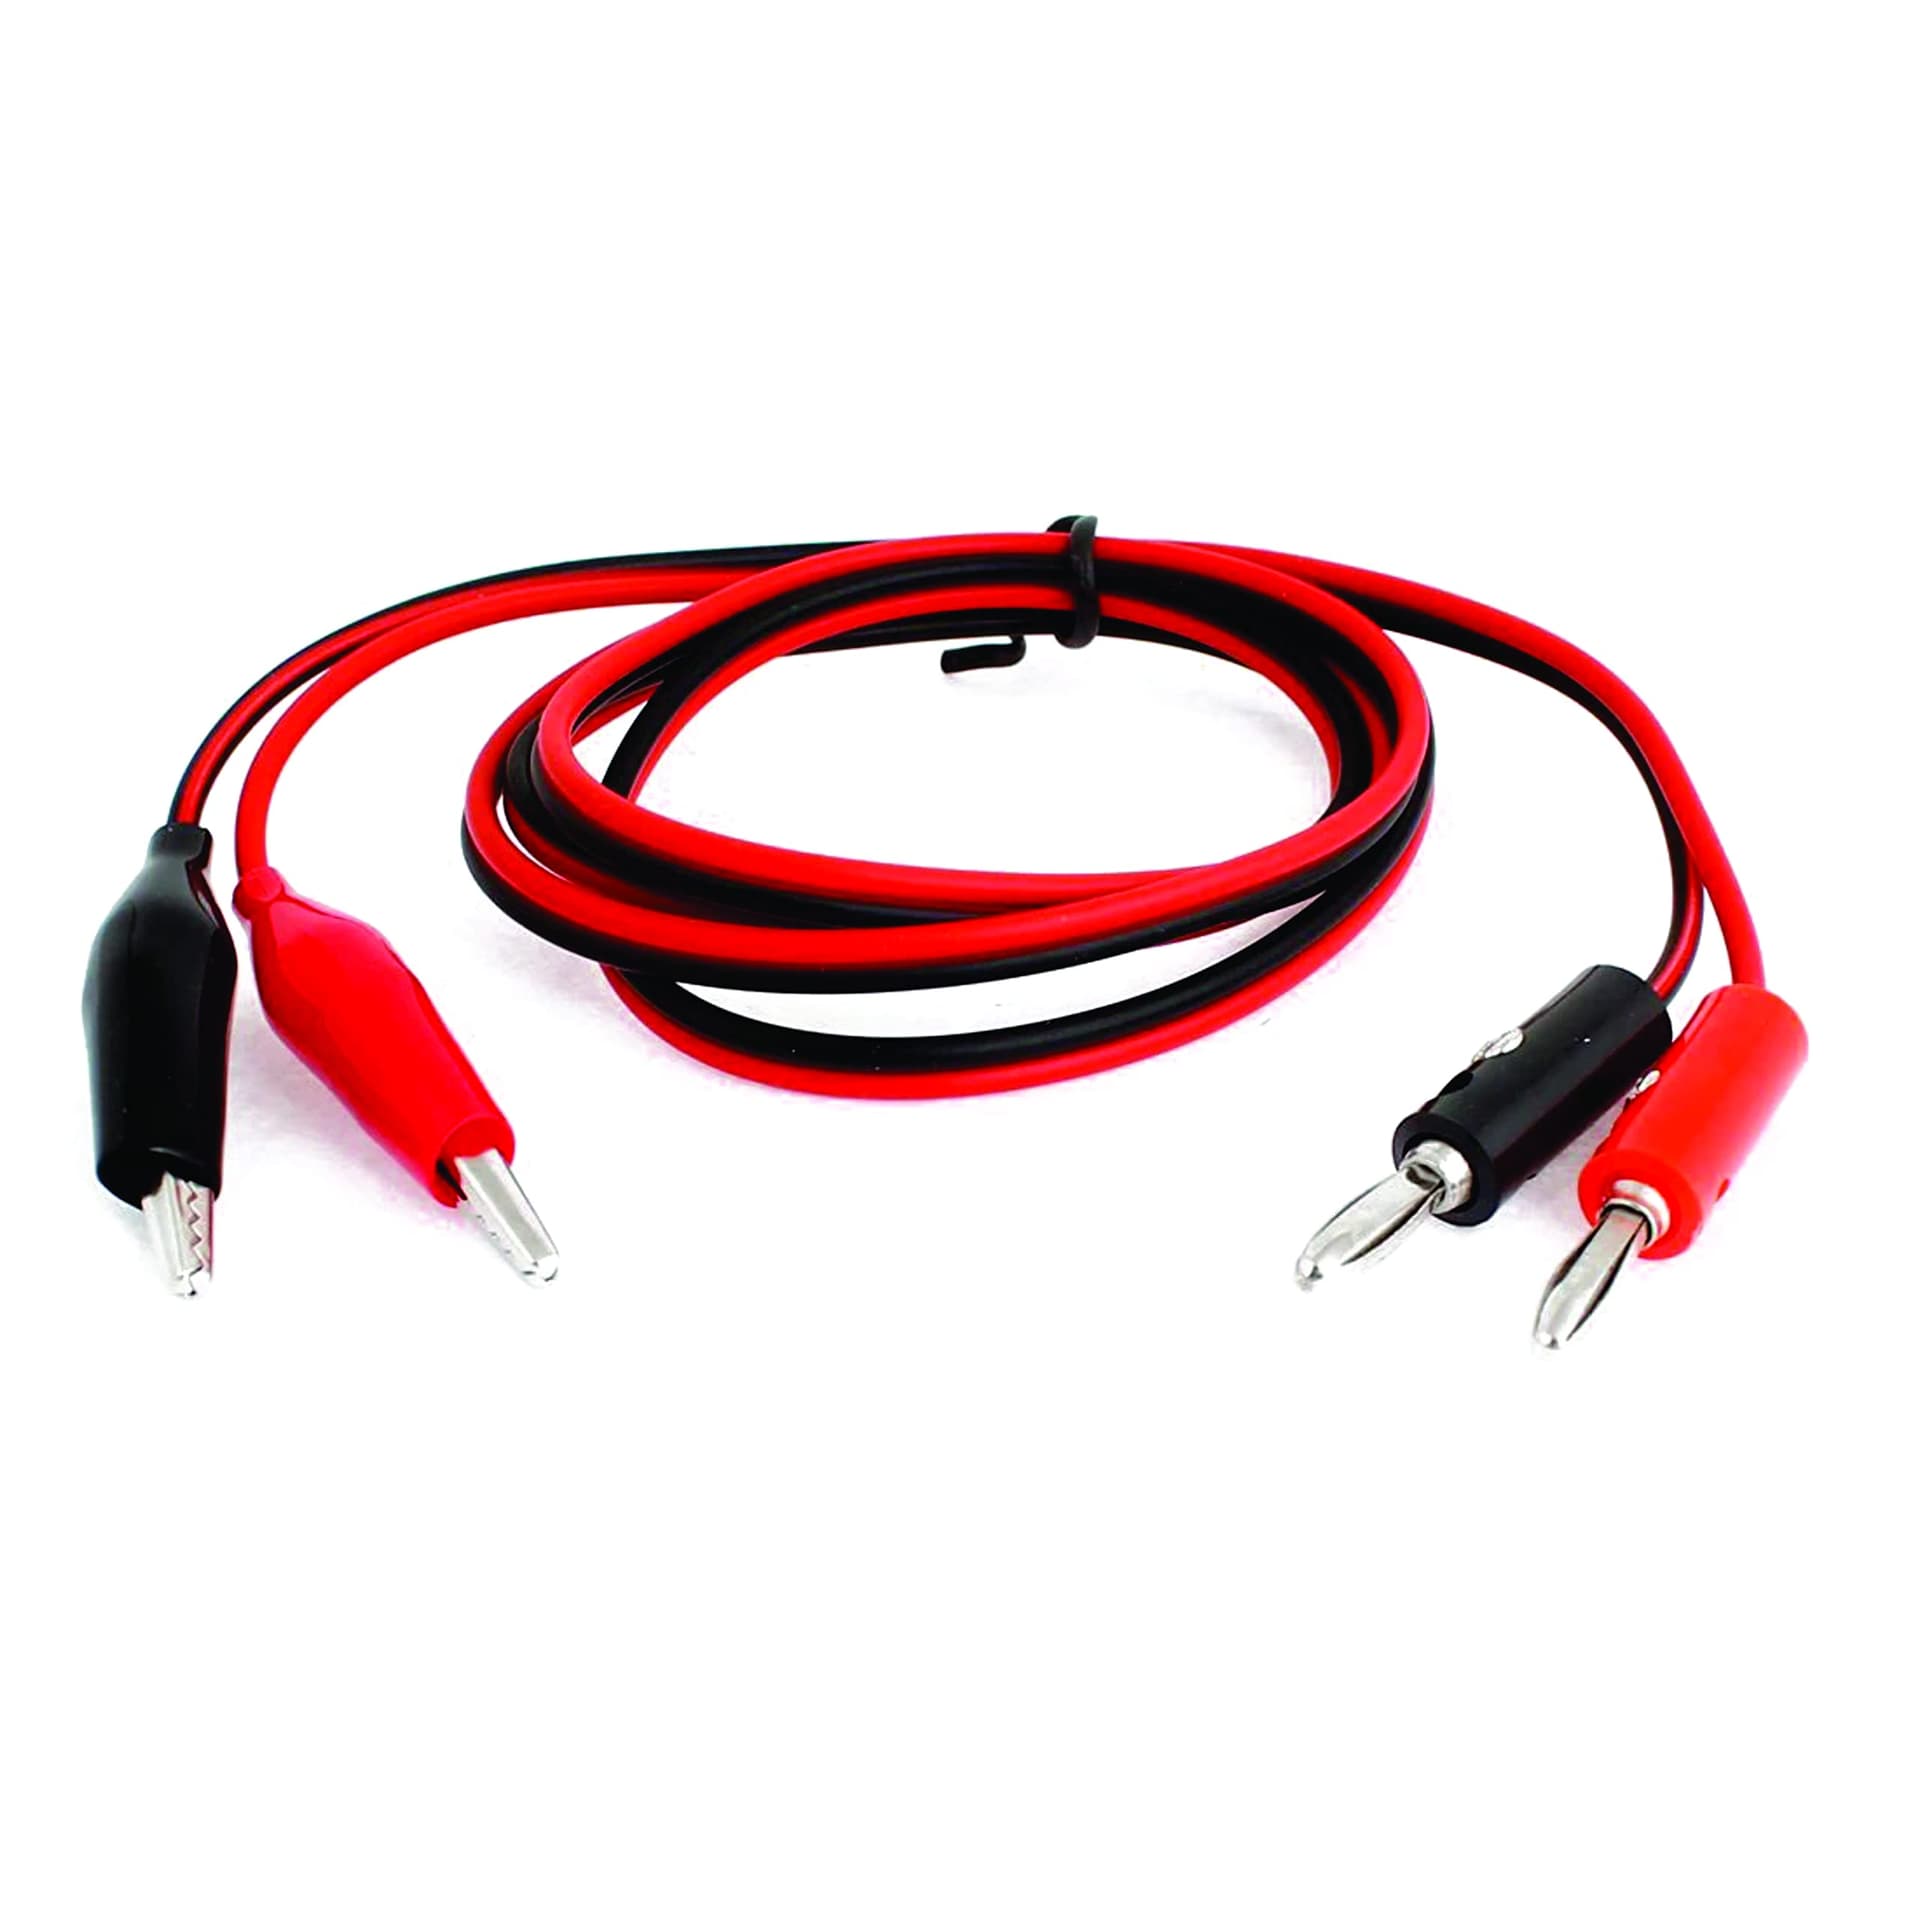
- The fan will be connected using the provided Banana-to-Crocodile cable:
- Launch the Physlogger application and load the session file provided in the resources section.
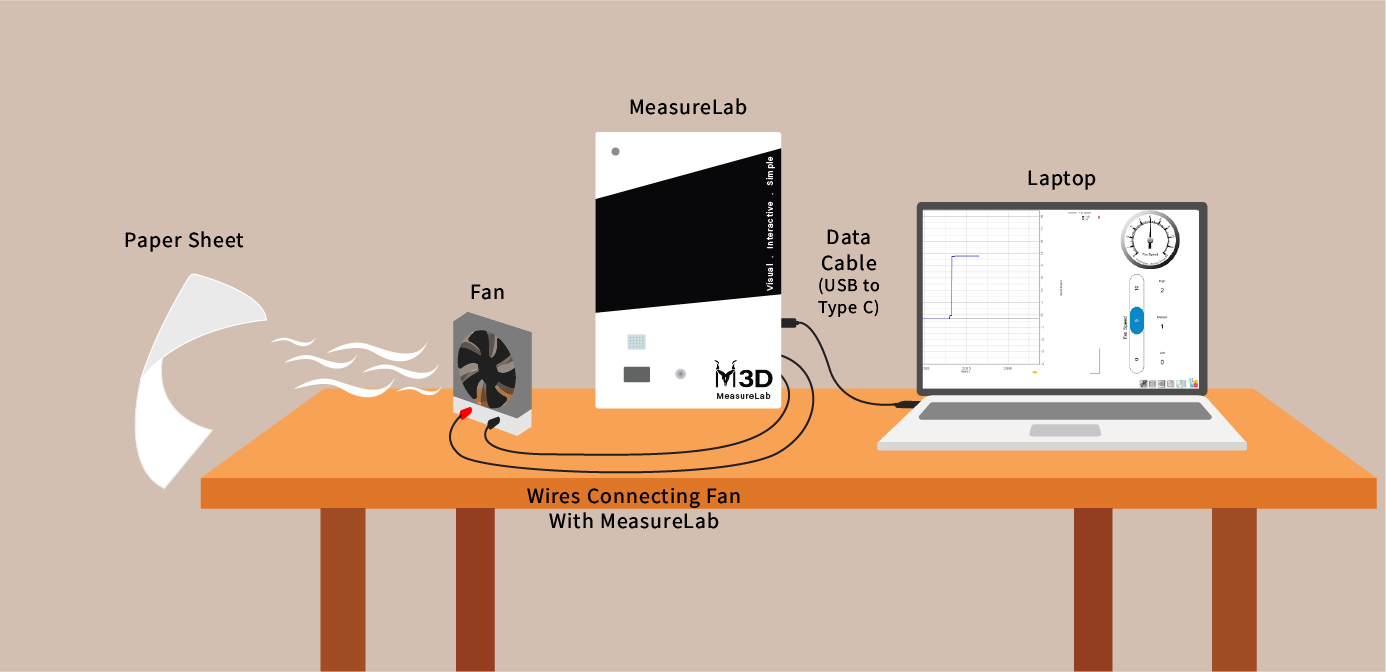
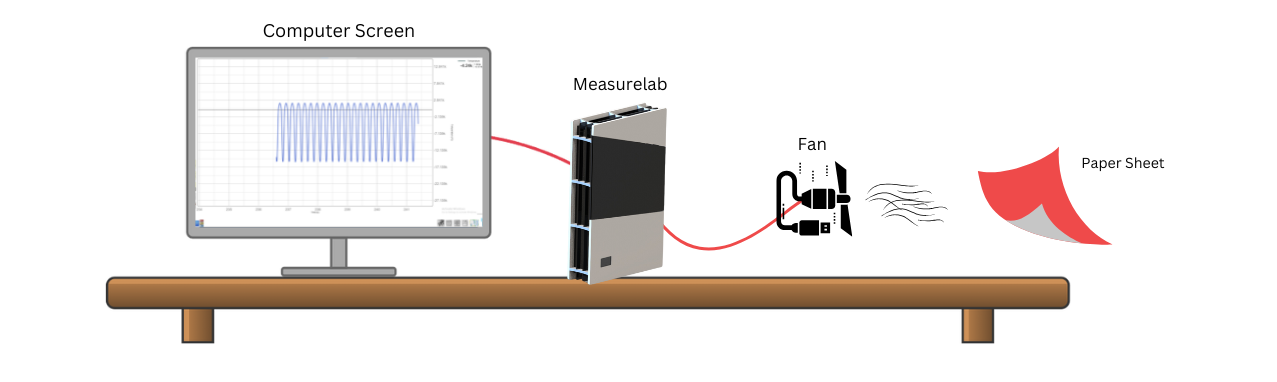
- Your setup will look like this:
Introduction: (10 minutes)
-
Starting Simple – What is MeasureLab?
The teacher introduces the MeasureLab equipment.
You may ask the students:- “Have you ever turned a dial on the stove to make it hotter? Or pressed the volume button on a speaker to make it louder?”
- “Today, we’ll be controlling a fan using MeasureLab. We’re going to see what happens when we change something called voltage, and how it affects how fast the fan spins.”
Show the fan setup on MeasureLab:
- “This slider on the screen lets us change the voltage, which controls how fast the fan spins.”
Introducing Variables with Simple Real-Life Examples:
-
Independent Variable Example:
- “Have you ever opened a faucet to get more water? The more you open it, the more water comes out, right? Changing the amount of water by opening the faucet is like our independent variable.”
- “In our experiment, we’ll be changing the voltage, just like opening the faucet to get more water. Voltage is the thing we control—that makes it independent.”
-
Dependent Variable Example:
- “When you open the faucet, the amount of water that comes out depends on how much you turn the knob. In the same way, the fan speed will depend on how much voltage we use. That makes fan speed our dependent variable.”
More Examples to Reinforce Understanding:
- “When you blow harder on a pinwheel, it spins faster. The harder you blow (independent variable), the faster it spins (dependent variable).”
- “If the temperature of a oven is higher (we can control it, the cookies bake quickly)”
Ask: “Can you think of other things that change depending on how much you control something?”
Hands-On Exploration (25 minutes)
Part 1: Understanding Variables Through Exploration
- Step 1: The teacher demonstrates how to use the on-screen slider in MeasureLab to adjust the voltage and control the fan’s speed. The students observe how the fan spins faster or slower as the voltage changes.
[Image of voltage slider to be added here]
-
Step 2: In groups, students take turns adjusting the voltage themselves, observing how the fan speed changes in real-time on the live plot.
-
Focus on Variables with Simpler Examples:
- As they experiment, the teacher guides them through understanding independent and dependent variables:
- Independent Variable Example: “When you press the accelerator in a car, the more you press it, the faster the car goes. You are controlling the speed with the accelerator—that’s the independent variable.”
- Dependent Variable Example: “The faster the car goes depends on how much you press the accelerator. In our experiment, the fan speed depends on how much voltage we use—that’s the dependent variable.”
- As they experiment, the teacher guides them through understanding independent and dependent variables:
Part 2: Adjusting Voltage and Observing Fan Speed
-
Voltage Settings:
Students will adjust the voltage on MeasureLab and record how the fan speed changes at different values.
They will observe and note down the fan speed at different voltage values (e.g., 2V, 5V, 10V, etc.) and fill in their observations.Follow-up Questions:
Instead of predictions, students will answer questions about the results:- “At which voltage did the fan spin the fastest?”
- “Did the fan spin slowly or quickly at low voltage? Why do you think that happened?”
- “What did you notice when you increased the voltage to a higher number? How did the fan speed change?”
Guided Activity (15 minutes)
Worksheet Activity:
-
Voltage and Fan Speed Table:
Students will adjust the voltage and record how the fan speed changes.
Voltage Setting Observation (Fan Speed) 2V 5V 10V Follow-up questions to record:
- “Which voltage setting gave the fastest fan speed?”
- “How did the fan behave at the lowest voltage? Did it spin at all?”
- “What happened as you increased the voltage to its highest setting?”
-
Live Plot Interpretation:
Students will observe the live plot showing how voltage affects the fan speed.
Ask them to note:- “How does the live plot change when we increase the voltage? What happens when we lower it?”
Summary and Reflection (10 minutes)
-
Conclusion:
- Summarize the key takeaways:
- “Today, we saw how changing the voltage—our independent variable—affected the fan speed—our dependent variable. We used MeasureLab to control the fan and observe real-time changes in the plot.”
- Summarize the key takeaways:
-
Reflection Questions:
- “What did you learn about how voltage changes the fan speed? Can you think of other things in real life that change when you control them?”
- Ask: “What do you think voltage is? And why do you think it was affecting our fan speed?”
Allow students to answer based on their observations, paving the way for the explanation of voltage and current in the next session.
Glossary:
- Independent Variable: The thing we control in an experiment (voltage).
- Dependent Variable: The thing that changes because of what we controlled (fan speed).
- Live Plot: A plot that shows real-time changes as we adjust the voltage and fan speed.