Grade 6 - Session 3: “Expansion of Air with Heat”
Session Architect: Aleeza Ayaz - Markhor3D
Session Length: 50-60 minutes
Session Overview:
In this session, students will explore how air expands when heated and contracts when cooled, and how this affects pressure. Using the MeasureLab pressure sensor and a sealed syringe, they will observe real-time changes in air pressure caused by temperature shifts with hot and cold water. Students will analyze live plots, draw graphs, and identify key variables to understand the relationship between temperature and pressure in gases. This hands-on session emphasizes experimentation and data interpretation to uncover the behavior of air and the tools used to measure it.
Learning Objectives:
In this session, students will:
- Understand how air expands when heated and contracts when cooled.
- Learn what pressure is and how it relates to the motion of particles and the force they exert.
- Use Measurelab pressure sensor to measure the pressure of air in a sealed syringe.
- Use temperature changes (hot and cold water) to observe air expansion and contraction inside the tube.
- Explore the relationship between temperature and pressure for gases, focusing on the data from live plots.
- Interpret live plots of temperature and pressure changes during the experiment to see real-time cause-and-effect relationships.
- Draw and interpret graphs to visually represent data collected from the experiment, identifying independent and dependent variables.
- Understand the role of the equipment used in this experiment.
Teacher Resource:
Session File: ML63.plf (57.6 KB)
Equipment Required:
- MeasureLab with built-in temperature and pressure sensor.
- Syringe with Measurelab Pressure Sensor tube sealed at the end to measure the air pressure inside as it expands and contracts.
- PC/Laptop to display measurements and live plots.
- Hot and cold water baths to create controlled temperature changes (e.g., containers with hot water and ice water).
- Worksheet for recording data from the experiment.
- Pens, pencils, markers etc.
Teacher Aids:
- Projector (optional)
Preparation:
This step has to be done before the session on each workstation/apparatus by the teacher/session instructor:
- Make sure that each computer has Physlogger installed and can detect the Measrelab when connected to it using the provided cable.
- Each Measurelab should have access to a power outlet for sensors that require external power. For this session, Temperature Sensor Probe and the built-in Pressure Sensor will be used which require an external power source.
- Connect the Temperature Sensor to the Measurelab using the following port:

4. Launch the Physlogger application and load the session file provided in the resources section.
Your setup will look something like this:
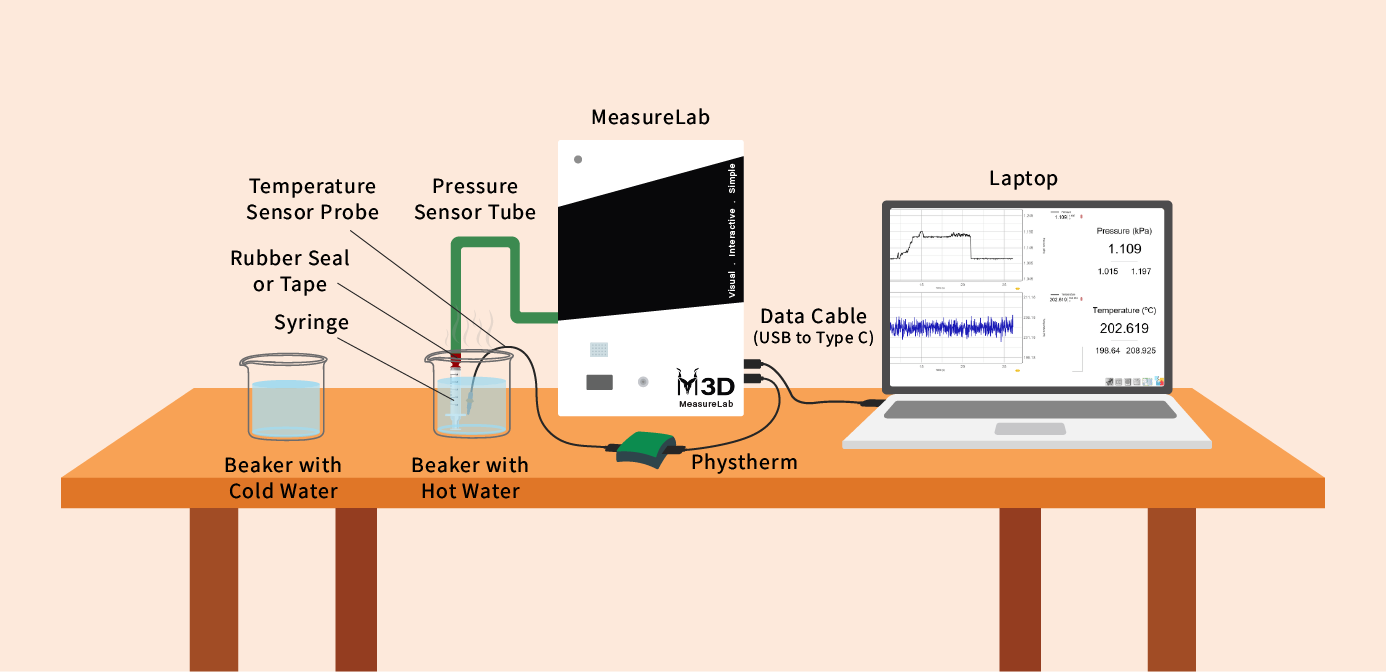
- Set up the apparatus as shown in the diagram above.
Introduction and Hands-On Exploration: (35 minutes)
Engaging Students with Everyday Examples of Pressure and Particle Motion:
- You may start by asking:
“Have you ever blown up a balloon? What happens to the balloon as you blow more air into it?”- Let students describe how the balloon gets bigger as more air is added.
- You may explain:
“When you blow air into a balloon, you’re adding tiny particles of air. These particles are constantly moving, bouncing around, and hitting the sides of the balloon. The more air you add, the more particles there are, and the harder they push against the sides of the balloon.”
Demonstration: Balloon Expansion Activity
- You may continue by showing the students a balloon with something written on it:
“What do you think will happen to this writing on the balloon when I blow air into it? Will the writing stay the same size or change?”- Let students make predictions about whether the writing will stretch or stay the same.
- Activity:
The teacher slowly blows air into the balloon. As the balloon inflates, the students will observe the writing or drawing stretch and expand along with the balloon. - You may ask as the balloon inflates:
“What do you notice happening to the writing on the balloon as I blow more air into it?” - You may explain:
“The writing stretches because the balloon is getting bigger as more air fills it. This happens because air particles are moving around inside the balloon and pushing against the sides, making it expand. This is like what happens when air heats up—its particles move faster and push out more, causing the air to expand and take up more space.”
What is Pressure?
- You may ask:
“So, when all these air particles are hitting the sides of the balloon, what do you think happens? What do we call the push or force that these particles create?”- Let students guess the term, guiding them toward pressure.
- You may continue:
“That’s right! The force that these air particles create by hitting the sides is called pressure. The more particles you have, or the faster they move, the more pressure there is. So, when we heat up air, the particles move even faster, and they hit the sides of the container harder. This increases the pressure.”
How Does Heat Affect Air?
- You may ask:
“What do you think happens to air when it gets hot? Have you ever noticed how a balloon left in the sun gets bigger or firmer?”- Let students respond, guiding them toward the idea that heat makes particles move faster.
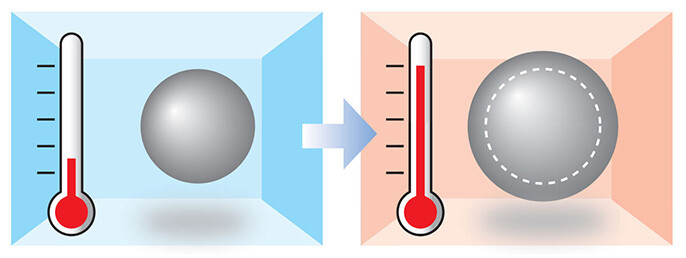
- You may explain:
“Exactly! When air gets hotter, the particles move faster. They bump into each other more and hit the sides of their container harder. This increases the pressure. Today, we’re going to see what happens when we heat air inside a copper tube. We’ll measure how both the temperature and pressure change.”
Step 1: Setting Up the Experiment
Step-by-Step Setup:
-
Prepare the Syringe with the Pressure Sensor Tube:
- Attach the pressure sensor to the syringe to monitor air pressure changes.
- Place the temperature probe into the water bath to track the water temperature.
- Secure the tube so it can easily be placed in both hot and cold water baths without being submerged too deeply.
-
Set up the Hot and Cold Water Baths:
- Have one container of hot water (not boiling) and one of cold water ready to use.
- Ensure the water baths are safely positioned for quick transitions between heating and cooling.
Step 2: Running the Experiment
Measuring Air Expansion and Contraction:
- You may ask the students:
“What do you think will happen to the air inside the syringe when we place it in hot water? Will the pressure inside go up, down, or stay the same?”- Let students share their predictions (they might mention air expansion, higher pressure, or temperature rise).
- You may say:
“Now we’ll place the syringe in hot water and observe how the air inside behaves. Let’s see what happens to the pressure as the temperature increases.”
Place the Tube in Hot Water:
- Carefully place the syringe in the hot water bath using heatproof gloves.
- Monitor the temperature and pressure using the sensors, and display the data live on the screen.
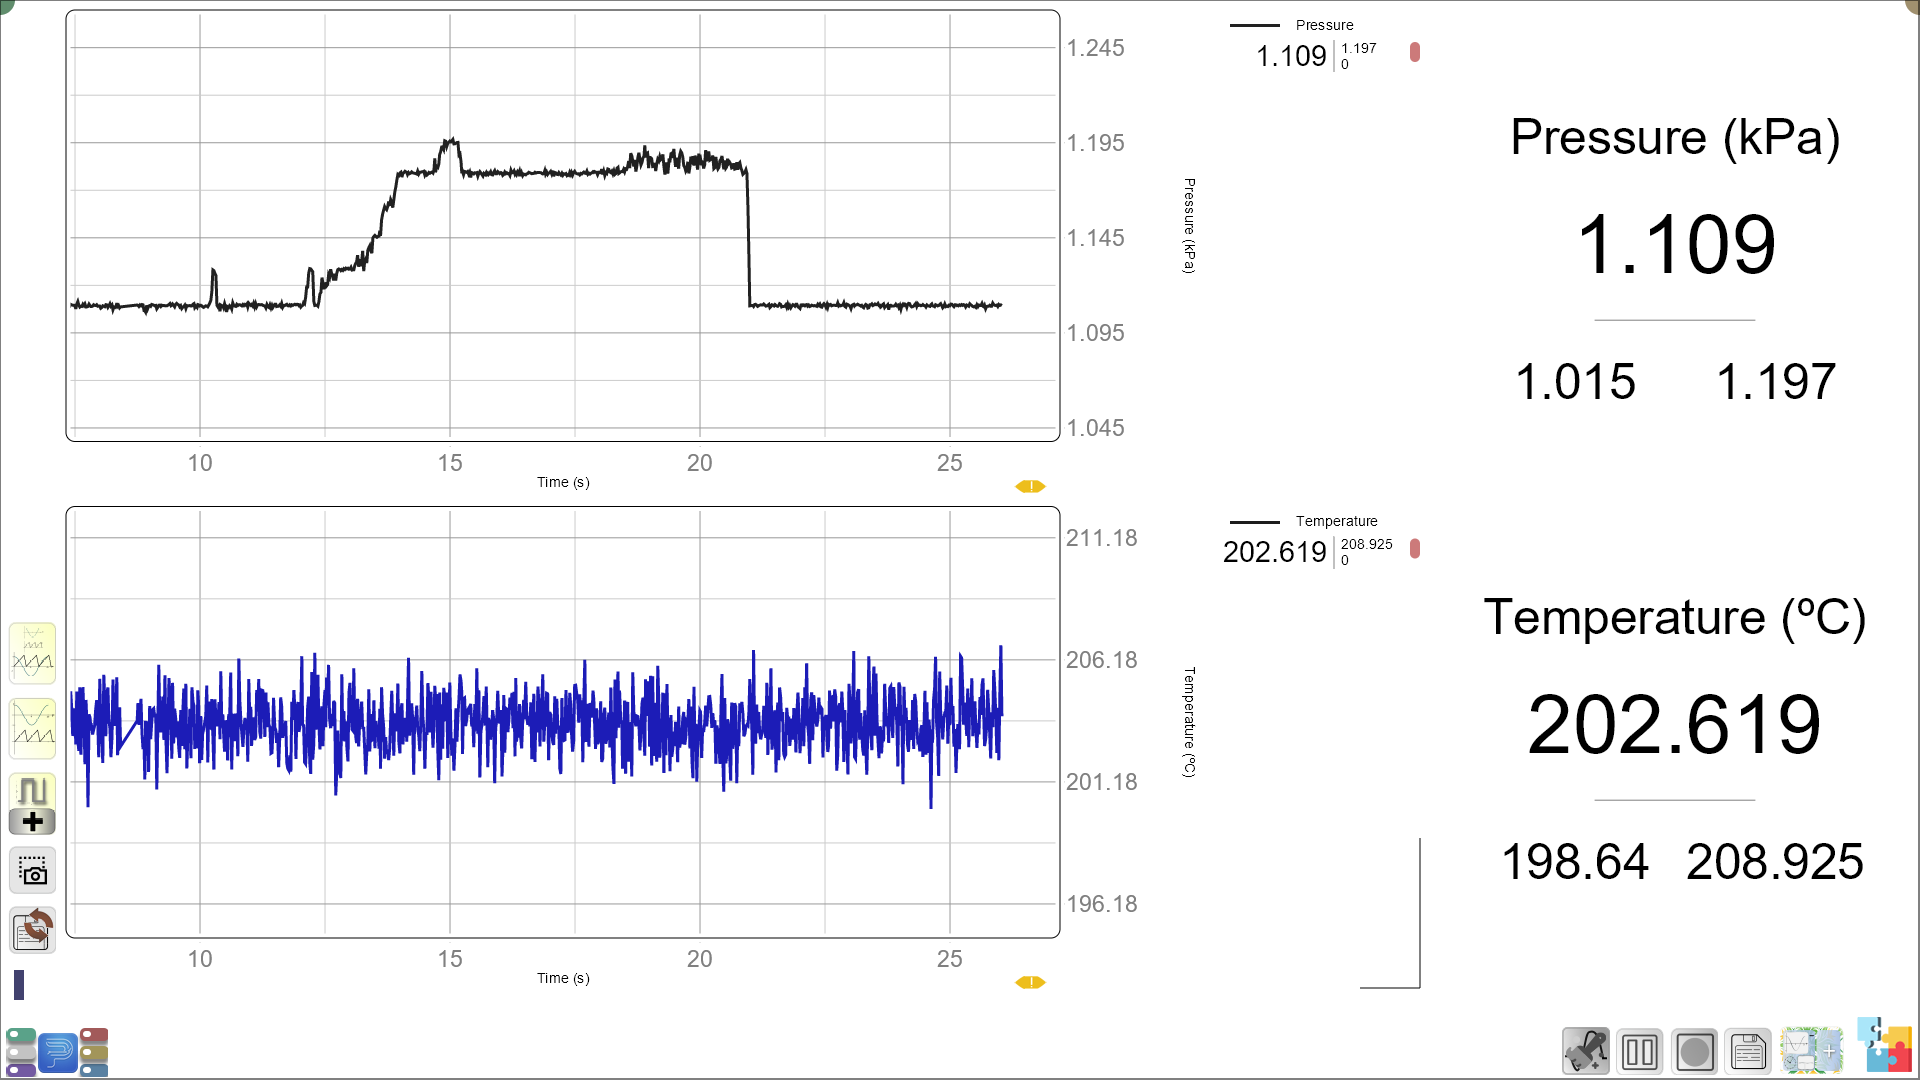
- You may ask:
“What do you notice about the pressure as the air inside the tube gets warmer?”
“How does the temperature on the live plot compare to the pressure? Do they increase together?”
Record Data:
- Have students observe and note down the readings for pressure and temperature over a few time intervals. Encourage them to watch how the live plot changes as the air expands.
Step 3: Cooling the Air
- You may ask:
“What do you think will happen to the air pressure if we place the syringe in cold water now?”- Guide students to predict whether the air particles will slow down, causing the pressure to drop as the air contracts.
Place the Tube in Cold Water:
- Move the syringe to the cold water bath.
- Students will observe how the pressure decreases as the air inside the tube cools and contracts. The particles slow down, pushing against the tube’s walls with less force.
Record Data:
- Have students note the pressure and temperature data again, observing how the live plot changes over time as the air cools.
Data Table:
| Time (Minutes) | Temperature (°C) | Pressure (atm) |
|---|---|---|
| 0 (Start - Hot Water) | ||
| 2 | ||
| 4 | ||
| 6 (Cold Water) | ||
| 8 |
Guided Activity and Discussion: (15-20 minutes)
-
Understanding the Results:
- You may ask:
“What did you observe happening to the pressure as the air inside the syringe was heated and then cooled?”- Explain that as the air is heated, the particles move faster and spread out, creating more pressure inside the tube. When the air cools, the particles slow down and the pressure drops.
- You may ask:
-
Follow-up Activity: Drawing and Interpreting Graphs
-
Creating the Graph:
- You may ask:
“Now that we’ve gathered our data, let’s create a graph that shows how the temperature and pressure changed over time.” - Have students draw a scatter plot or bar chart of their findings using the recorded temperature and pressure data.
- You may ask:
-
Labeling the Graph:
- You may explain:
“Let’s identify the independent variable (the one we changed) and the dependent variable (the one we measured).”
In this experiment:- The independent variable is temperature (because we controlled it by placing the tube in hot or cold water).
- The dependent variable is pressure (because we measured how it changed).
- You may ask:
“What labels should we put on our x-axis and y-axis?”
Guide them to place temperature on the x-axis and pressure on the y-axis.
- You may explain:
-
Questions for Analysis:
- You may ask:
“What does your graph show about the relationship between temperature and pressure?”
“Is the graph showing a trend? What happens to the pressure as the temperature increases?”
- You may ask:
- Comparing the Live Plot and Scatter Plot/Bar Graph:
- You may ask:
“Now that we’ve made our scatter plot or bar graph, how does it compare to the live plot we saw earlier?”- Wait for responses (students might mention how the live plot shows changes in real-time, while their graphs represent data points).
- You may follow up:
“Why do you think the live plot looks smoother, while our graph has distinct points? What can each of these visualizations tell us about the relationship between temperature and pressure?”
- Real-Life Applications:
- You may ask:
“Where do you think this happens in real life? Can you think of examples where air expands or contracts due to temperature changes?”- Some examples could include:
- Hot air balloons rising as the air inside them expands.
- Tires expanding in the heat and contracting in the cold.
- Closed containers that swell up in the heat and shrink when cold.
- Some examples could include:
- Relating Particle Motion to Pressure:
- You may explain:
“As we heated the air, the particles moved faster and spread out, creating more pressure inside the tube. When we cooled the air, the particles slowed down, and the pressure dropped because they weren’t hitting the sides of the tube as hard.”
Summary and Reflection (5-10 minutes)
Summarizing the Key Points:
- You may summarize:
“Today, we saw how heating and cooling air changes its pressure. As the temperature increased, the air particles moved faster, creating more pressure. When we cooled the air, the pressure dropped as the particles slowed down.”
Reflection Questions:
- You may ask:
“How did the live plot help you understand the relationship between temperature and pressure?”
“Can you think of another example where something expands when heated or contracts when cooled?”
Glossary:
- Pressure: The force exerted by particles of air when they hit the sides of a container.
- Temperature: A measure of how hot or cold something is.
- Expansion: When something increases in size, like air particles spreading out when heated.
- Contraction: When something decreases in size, like air particles moving closer together when cooled.
- Particle Motion: The movement of tiny air particles, which increases with heat and decreases with cooling.
- Live Plot: A graph that shows data in real time, allowing us to see how things like temperature and pressure change during the experiment