Grade 3 – Session: “Sound and Signals”
Architect: Aleeza Ayaz - Markhor3D
Session Length: 50-60 minutes
Session Overview:
In this session, students will use a sound sensor and live plot to measure and identify different sounds, such as claps, whispers, and background noise. They will observe how louder sounds create taller peaks on the plot, while softer sounds create smaller ones, learning to distinguish between different sound patterns. This session also introduces the concept of errors in measurements in a simple and relatable way, encouraging students to think critically about how data can sometimes be affected by mistakes or external factors. Through this activity, students will develop an understanding of how sound is visualized and the importance of accurate data collection.
Learning Objectives:
In this session, students will:
- Use sound sensors to measure different sound levels and observe real-time changes on a live plot.
- Understand how live plots represent changes in sound over time.
- Learn about errors in data collection and how to identify and explain them.
- Write an easy, formal definition of errors on their worksheets.
- Engage in a multidisciplinary activity incorporating sound, math, and critical thinking.
Equipment Required:
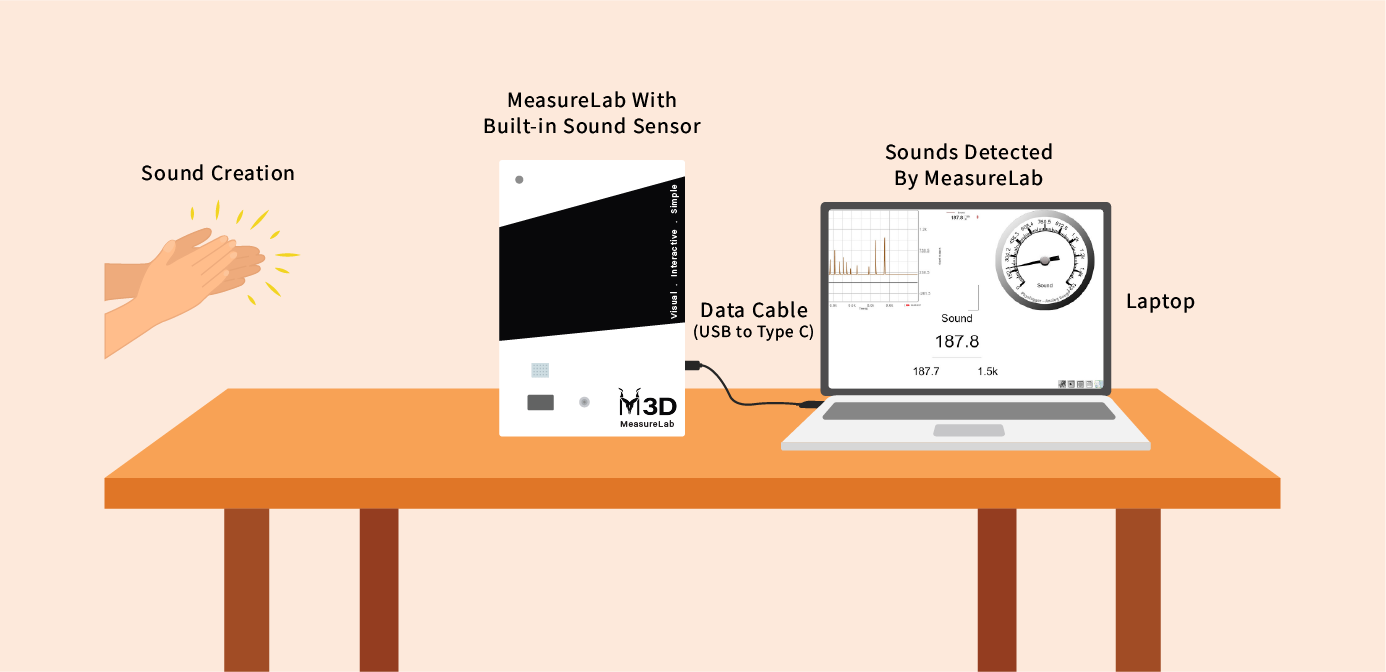
- MeasureLab with built-in sound sensor.
- Laptop or PC displaying the live plot and sound data.
- Sound-making objects (e.g., musical instruments, claps, recorded sounds, etc.).
- Worksheet to record observations, sound types, errors, and their analysis.
- Pens, pencils, markers etc.
Teaching Aids:
- Projector (optional, for displaying live plots).
- Sound-making devices or instruments (e.g., drum, clap sound).
Teacher Resource:
Session File: ML33.plf (55.7 KB)
Preparation:
This step has to be done before the session on each workstation/apparatus by the teacher/session instructor:
- Make sure that each computer has Physlogger installed and can detect the Measrelab when connected to it using the provided cable.
- Each Measurelab should have access to a power outlet for sensors that require external power. For this session, Sound Sensor will be used which requires an external power source.
- Launch the Physlogger application and load the session file provided in the resources section.
Your setup will look something like this:
Introduction: (10-15 minutes)
You may start by saying:
“How are you today, class? Let’s play a game. When I count to 3, everyone clap as loudly as you can. Ready? 1… 2… 3!”
After everyone claps, you may ask:
“Did you hear how loud that was? Now let’s all whisper. How quiet can we be?”
You may continue:
“Today, we’re going to measure those sounds using a special tool that will show us how loud or quiet the sound is, using something called a live plot.”
You may ask:
“What do you think will happen when the sound gets louder? How will the live plot change?”
You may explain:
“We’ll be watching a plot today that moves up when the sound is louder and down when the sound is softer. We’ll also learn what happens when we make mistakes in measuring—something called errors.”
Easy Definition of Errors (For the Worksheet)
You may introduce a simple definition of errors for students to write on their worksheet.
“Sometimes things don’t go exactly the way we want. When our measurements don’t make sense, that’s called an error.”
Definition for the Worksheet:
Error: A mistake in our measurements that makes the data wrong or unexpected.
Hands-On Exploration: (25-30 minutes)
Step 1: Exploring the Sound Sensor
- Simple Sound Test:
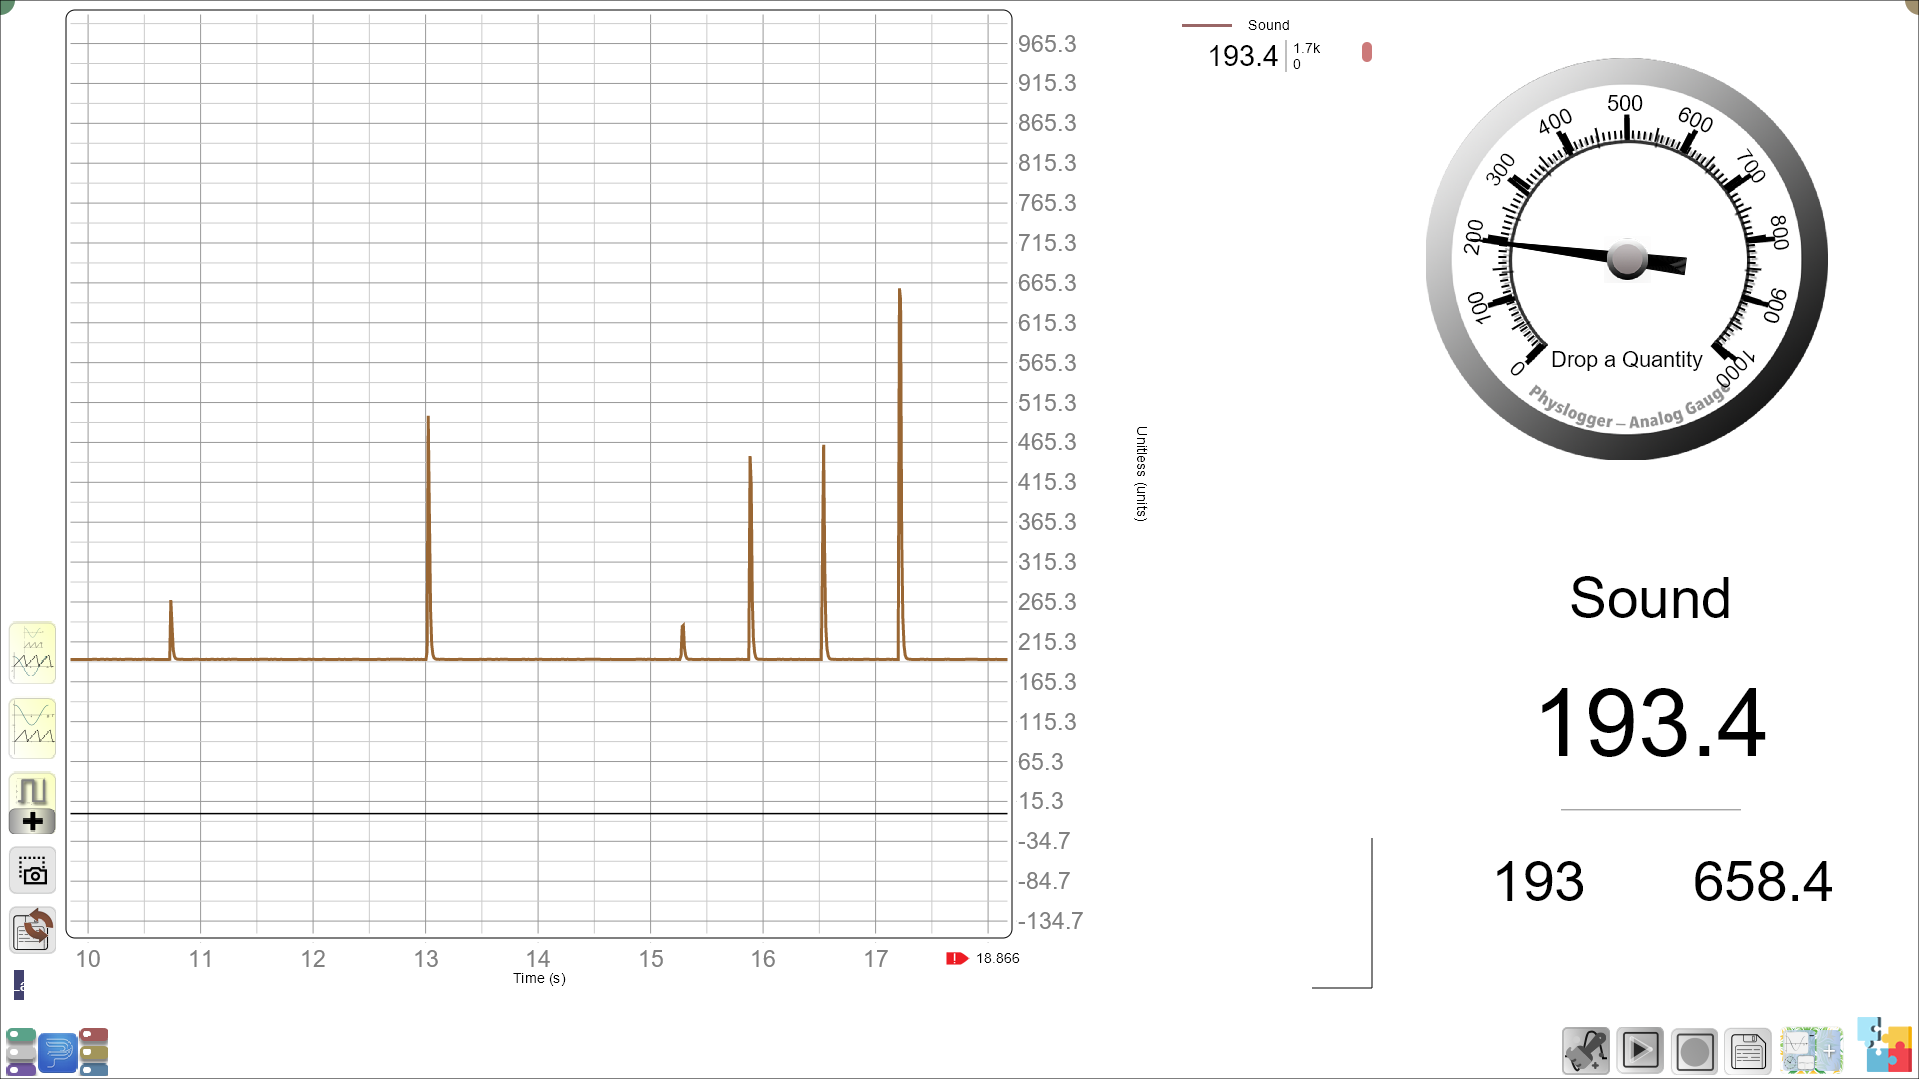
You may continue guiding students as they take turns clapping, whispering, and making different sounds with objects. As each sound is made, have them watch the live plot and observe how the sound is reflected as a moving line. They can also observe the change using the audio meter on the right.
You may ask:
- “What happened to the line when you clapped?”
- “What about when you whispered?”
Encourage them to observe the relationship between loud and quiet sounds and the line on the plot.
Step 2: Introducing Errors
-
Activity: Detecting Errors in a Clap Test:
You may say:
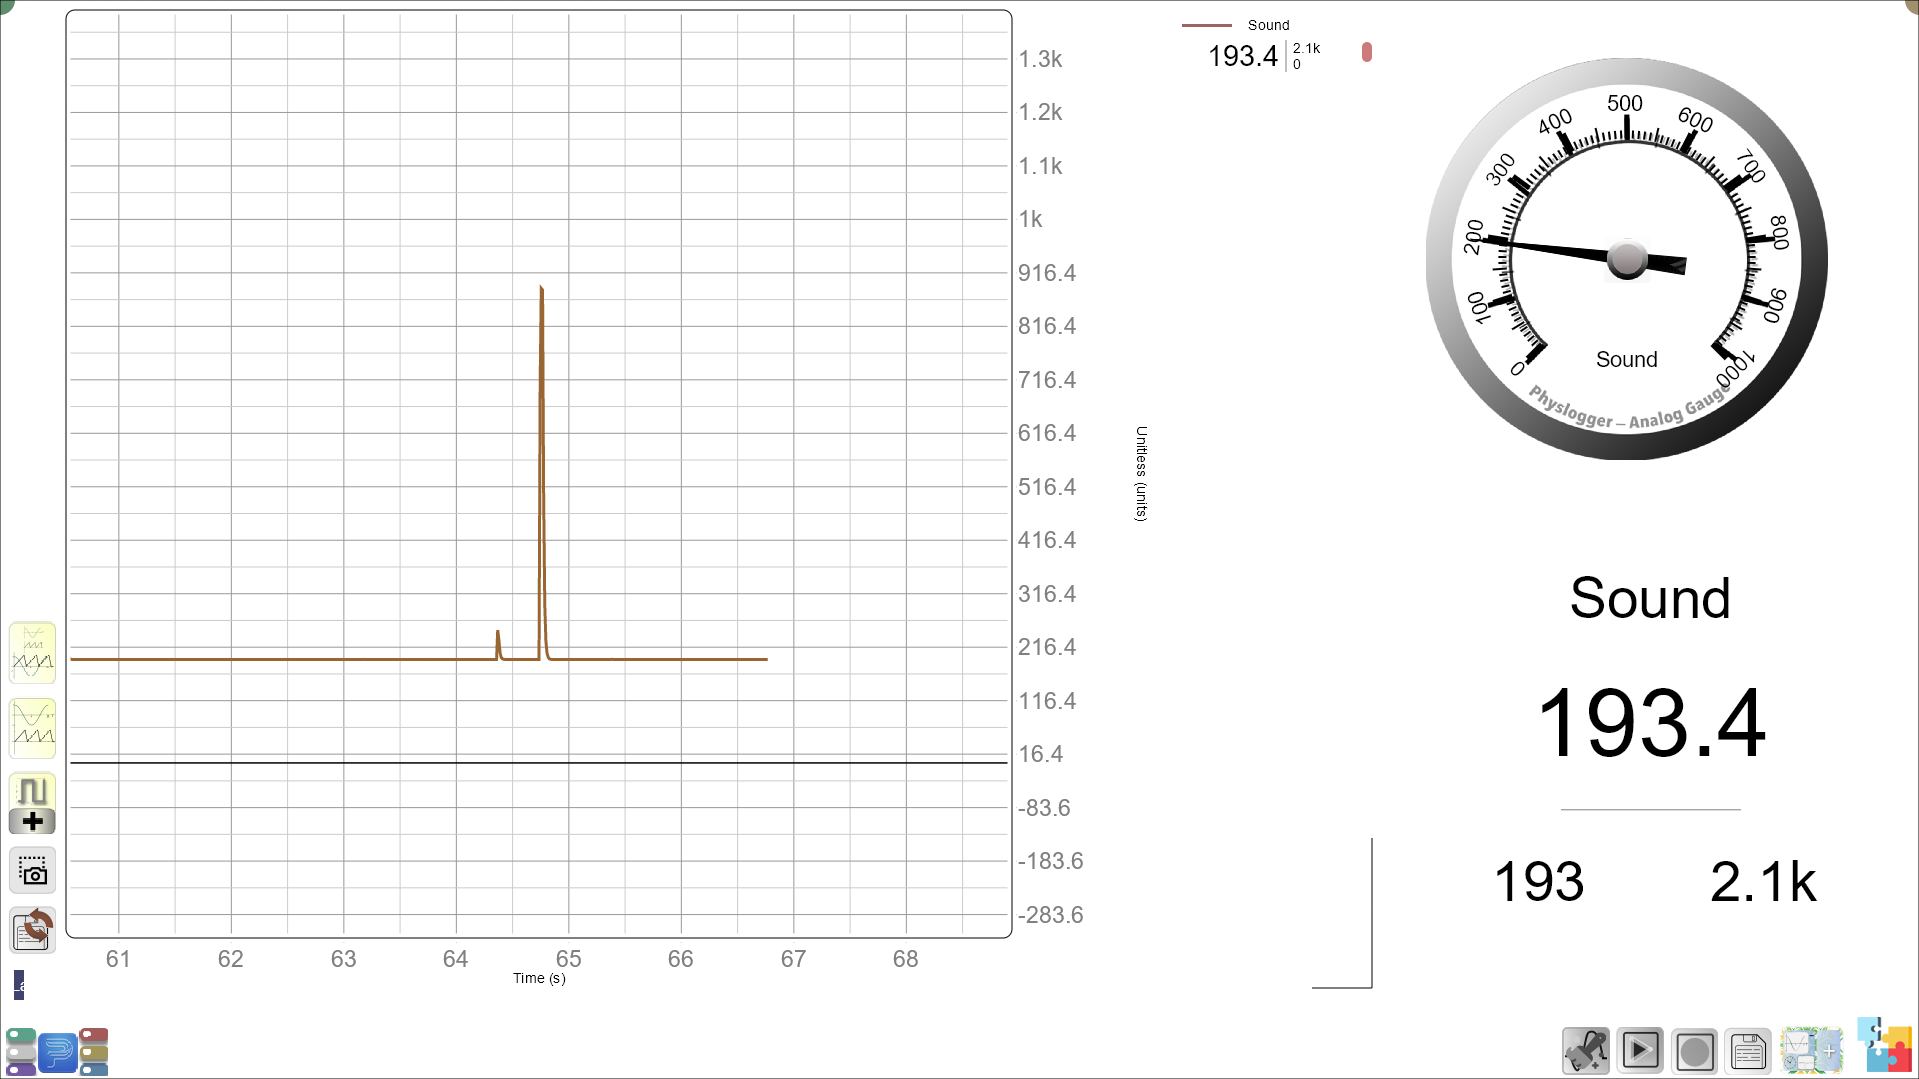
“Now, let’s try something fun. I’m going to ask one of you to clap, but someone else will make a noise in the back of the room. Can you find the noise on the live plot? Let’s see if you can tell where the mistake is.”As one student claps, another student (or the teacher) makes a distracting noise from the back of the classroom, like tapping a desk or dropping an object. Have the students observe the live plot and identify where the error or noise shows up.
You may ask:
- “Can you spot where the extra sound came in? How did it affect the plot?”
- “How can you tell the clap from the other noise?”
Teacher’s Role:
Guide students to look closely at the live plot and help them differentiate between the expected sound (the clap) and the error (the background noise). This interactive activity encourages them to engage with the data.
Step 3: Error Detection and Analysis
-
Identifying Errors:
Ask students to look at the live plot and identify where errors may have occurred. They can circle or point out where the plot looks odd or unexpected.You may guide them:
- “Can you spot where the line didn’t make sense? What might have caused the error?”
-
Analyzing the Errors:
Encourage students to think about what caused the errors, whether it was too much noise or an unexpected sound.You may ask:
- “What do you think caused these errors?”
- “How could we fix this next time?”
Worksheet Activity:
-
Recording Observations and Errors:
The worksheet will have a table for students to fill in with the types of sounds they made, how the live plot looked, and whether an error occurred.Sound Type Live Plot Observation Error Occurred? (Yes/No) What caused the error? Loud Clap Tall line No N/A Whisper Short line No N/A Background Noise Messy plot Yes Too much noise Multiple Sounds Jumpy, uneven line Yes Too many sounds at once -
Follow-Up Questions:
- “What did you notice about the errors? When did they happen?”
- “What could we do to prevent errors next time?”
-
Definition of Error:
Students will write down the formal definition of error:
Error: A mistake in our measurements that makes the data wrong or unexpected.
Summary and Reflection: (10-15 minutes)
-
Concluding the Activity:
You may say:
“Today, we explored how sounds are shown on a live plot. We saw how loud and quiet sounds made the line go up or down, and we also learned that sometimes, things go wrong—these are called errors.”Reflection Questions:
- “Why do you think it’s important to catch errors when we’re measuring something?”
- “What might cause errors, and how could we avoid them next time?”
Glossary:
- Sound Sensor: A device that measures the loudness or intensity of sound.
- Live Plot: A graph that shows real-time changes as we measure something (in this case, sound).
- Error: A mistake in our measurements that makes the data wrong or unexpected.
- Volume: How loud or quiet a sound is.
- Data Collection: Recording and organizing the information we gather from experiments.