Grade 2 – Session 2: “Sound Off: How Loud Can You Be?”
Architect: Aleeza Ayaz - Markhor3D
Session Length: 50-60 minutes
Session Overview:
In this session, students will dive into the world of sounds by exploring how loud or quiet different noises can be. Using MeasureLab’s sound sensor and live plot, they’ll experiment with claps, whispers, and instruments to see how the line on the screen changes with sound intensity. Through this hands-on activity, they’ll begin to understand that the taller the peak on the plot, the louder the sound. They’ll also learn about decibels, the unit used to measure sound intensity, and how we use it in everyday life. By predicting, observing, and recording their results, students will develop a foundation for understanding sound in a fun and interactive way.
Learning Objectives:
In this session, students will:
- Use the sound sensor to measure the loudness of different sounds.
- Understand how the live plot changes based on how loud or quiet a sound is.
- Begin learning about decibels as the unit used to measure sound intensity.
- Associate higher peaks in the live plot with louder sounds and lower peaks with quieter sounds.
- Explore how sound intensity can be measured and how sound is represented visually.
Equipment Required:
- MeasureLab with built-in sound sensor.
- Laptop or PC to display the live plot of sound intensity.
- Different objects or instruments to produce sound (e.g., bells, claps, tambourines, etc).
- Worksheets to record predictions and observations.
Teacher Resource:
Session File: ML22.plf (55.5 KB)
Teaching Aids:
- Projector (optional, to display live plot)
Preparation:
This step has to be done before the session on each workstation/apparatus by the teacher/session instructor:
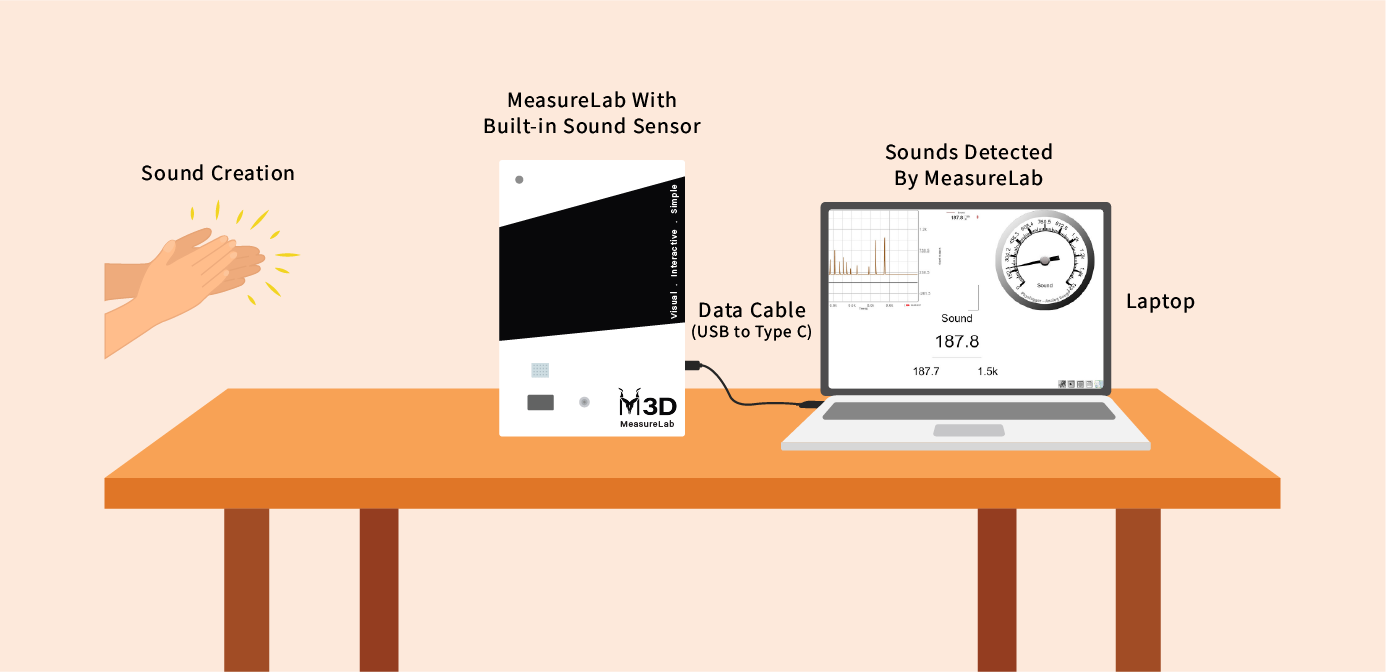
- Make sure that each computer has Physlogger installed and can detect the Measrelab when connected to it using the provided cable.
- Each Measurelab should have access to a power outlet for sensors that require external power. For this session, the sound sensor will be used which does not require an external power source.
- Launch the Physlogger application and load the session file provided in the resources section.
Your setup will look something like this:
Introduction: (10 minutes)
You may begin by asking:
“How many of you think you can make the loudest sound? Do you think a clap, a shout, or maybe a bell will be the loudest? Let’s find out together!”
- Engage students in a brief discussion about loud and quiet sounds they’ve heard.
You may then explain:
“Today, we’re going to see exactly how loud or quiet different sounds are! We’ll use MeasureLab to measure sound intensity in decibels—a unit we use to tell how loud a sound is. The higher the number, the louder the sound, and we’ll see this on the live plot. The higher the line goes, the louder the sound is, and the lower the line, the quieter the sound.”
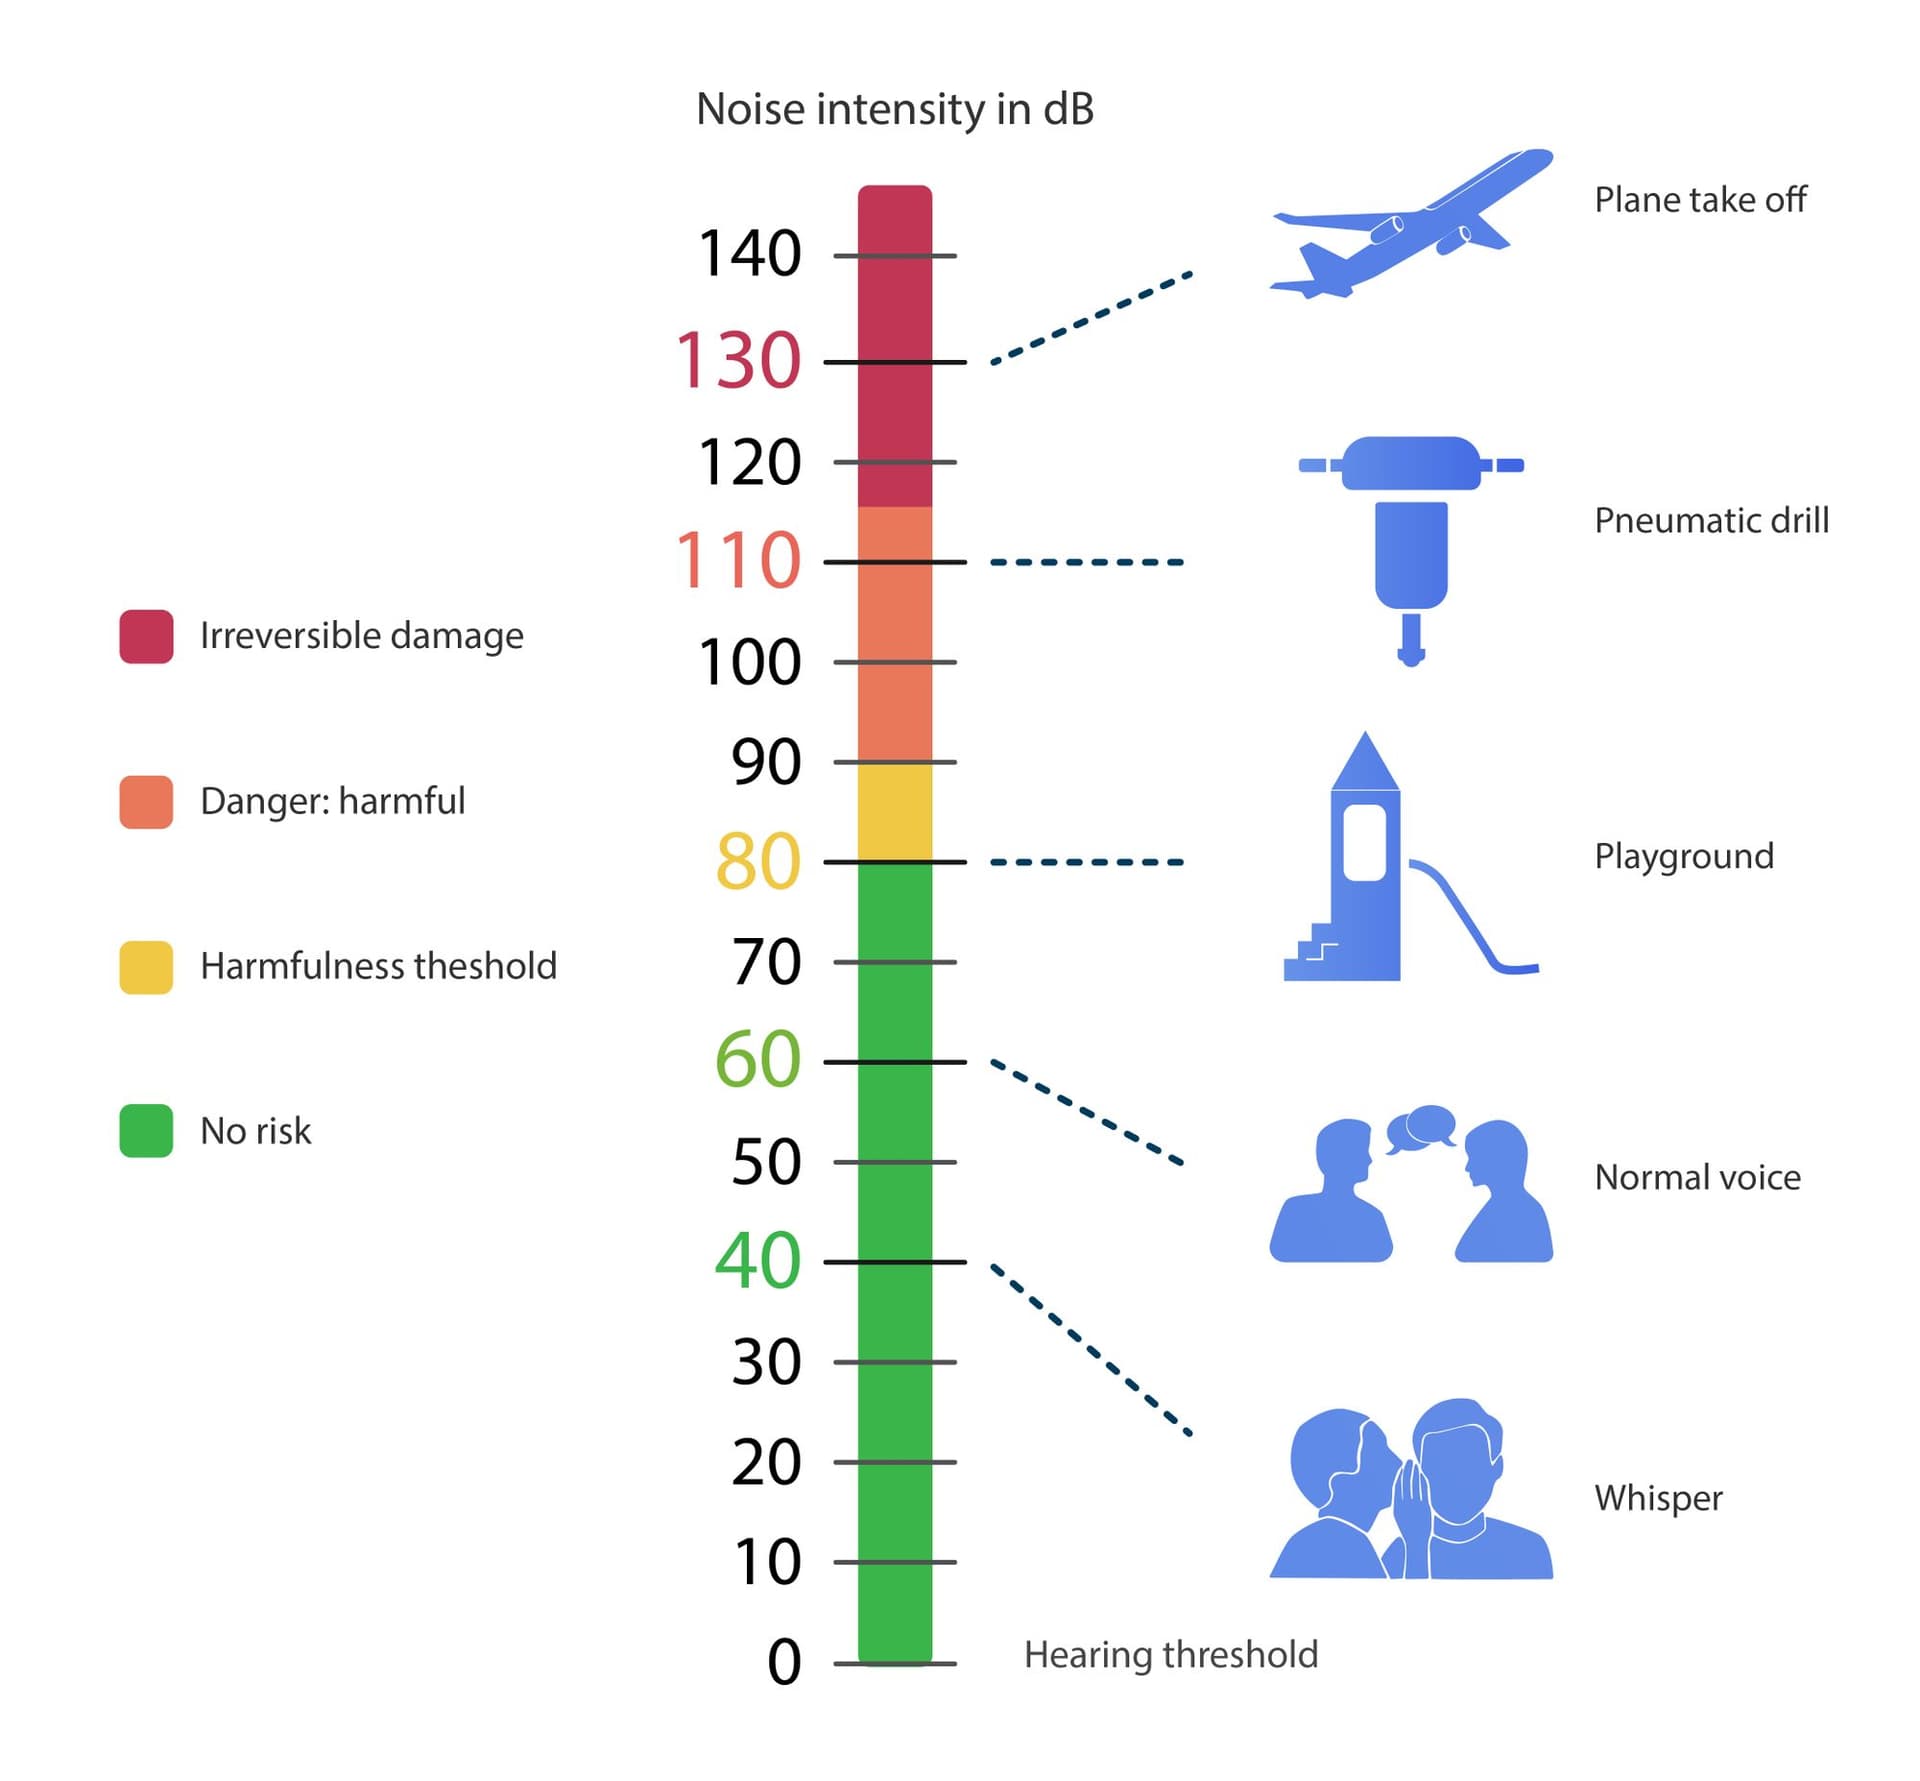
You may ask:
“What sounds do you think will make the highest line on the plot? What about the lowest?”
Hands-On Exploration: (25-30 minutes)
Setting Up the Activity:
-
Group Setup:
- Divide the class into small groups (3-4 students per group).
- Each group will take turns using the sound sensor to measure sounds produced by clapping, shouting, or using simple instruments like bells or tambourines.
-
Experimenting with Sounds:
- One student in the group will make a sound (e.g., clap, shout, or play an instrument), while the others observe the live plot on MeasureLab.
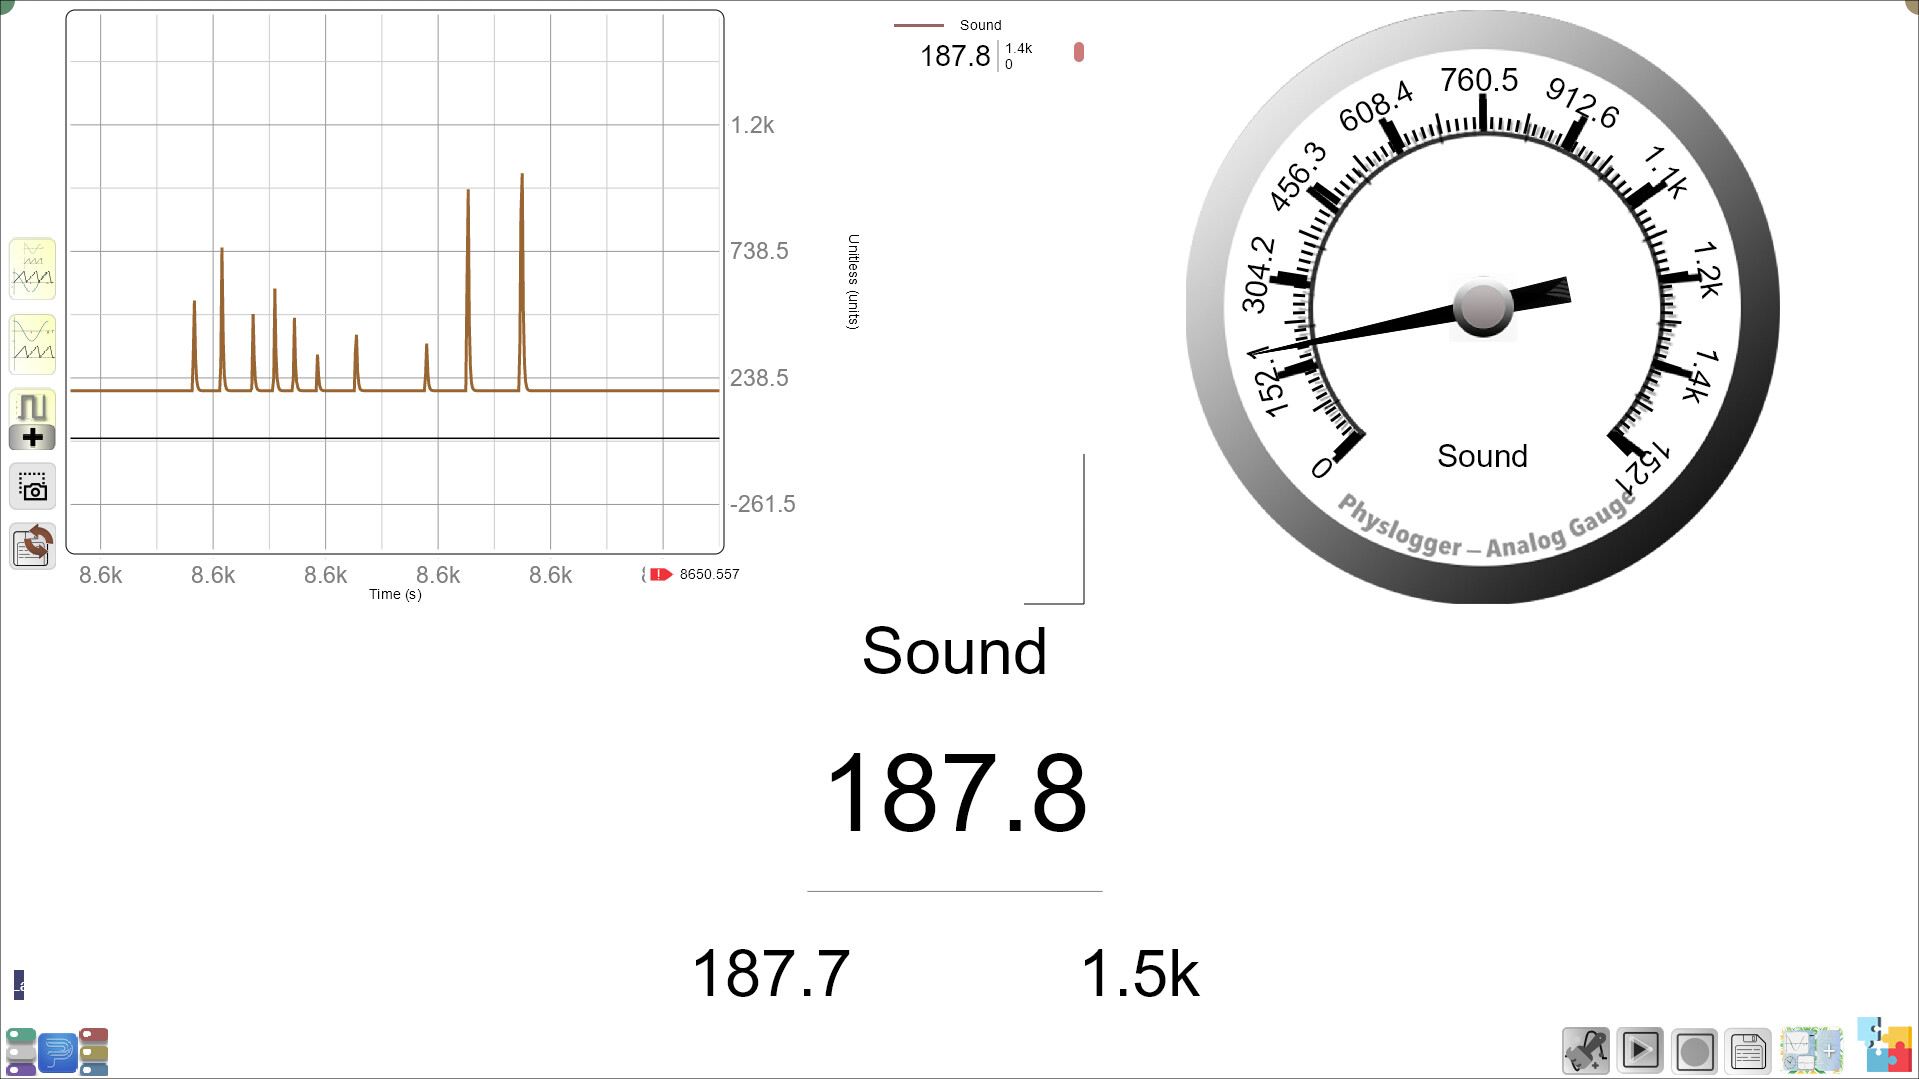
- Students will take turns producing sounds and watching how the live plot and the audio meter changes in response to louder or quieter sounds.
You may guide them by saying:
- “Let’s start with a clap. Watch the plot—what do you see when you clap?”
- “Now try making a quiet sound, like a soft whisper. How is the line on the screen different from the loud clap?”
- “Can you see the difference between a loud and quiet sound on the plot? Which sound made the highest peak?”
Introduce Decibels:
- You may explain:
- “When you clap loudly, the sensor measures how loud it is in decibels—a unit we use to measure sound. The louder the sound, the higher the number and the higher the line on our plot.”
Encourage Prediction:
- Before making each sound, you may ask:
- “How high do you think the plot will go for this sound? Will it be louder or quieter than the last sound?”
Examples of Sounds to Test:
- Claps (soft vs. loud)
- Shouts
- Bell ringing or tambourine
- Snapping fingers or whistling
- Quiet humming or soft whisper
Guided Activity: (15 minutes)
Worksheet Activity:
Each student will have a worksheet with sections to record their predictions and observations.
-
Prediction and Observation Table:
Students will predict which sounds will be the loudest or quietest and write down their predictions. After making the sounds, they will observe and record whether the sound was loud or quiet based on the live plot.Sound Type Prediction (Loud/Quiet) Observation (Loud/Quiet) Clap _______________________ ________________________ Shout _______________________ ________________________ Bell _______________________ ________________________ Whisper _______________________ ________________________ Knock Snapping Fingers _______________________ ________________________ -
Live Plot Interpretation Question:
The worksheet will include a graph with two live plot lines representing two sounds. Students will be asked to identify which plot line represents the louder sound.You may ask:
- “Which line do you think shows the louder sound? Why?”
This helps students practice identifying and interpreting the difference between louder and quieter sounds based on the height of the plot lines.
-
Follow-Up Question on Unit of Measurement:
- “What is the unit used to measure how loud a sound is?”
Answer: Decibel (dB)
- “What is the unit used to measure how loud a sound is?”
-
Reflection Section:
- You may ask:
- “What did you learn about sound today?”
- “Why do you think some sounds are louder than others?”
- You may ask:
Summary and Reflection: (5-10 minutes)
You may conclude by saying:
“Today, we learned that sound can be loud or quiet, and we can measure it using decibels. The higher the decibel number, the louder the sound. We could see this with our live plot too—the higher the peak, the louder the sound.”
Reflection Questions:
- “What sound made the highest peak on the plot today?”
- “Why do you think decibels are important in measuring sound?”
Glossary:
- Sound Intensity: How loud or soft a sound is.
- Live Plot: A plot that shows changes in sound in real-time.
- Peak: The highest point on the plot, which represents the loudest sound.
- Decibel (dB): The unit we use to measure how loud or quiet a sound is.