Grade 4 Session 1: “Getting Started with MeasureLab – Exploring the Photogate Sensor”
Architect: Aleeza Ayaz - Markhor 3D
Duration: 50-60 Minutes
Session Overview:
In this introductory session, students will be introduced to MeasureLab and the Photogate sensor, sparking their curiosity about how we can measure object movement. Through hands-on activities, they will explore how objects passing through the Photogate create pulses on a live plot, learn to differentiate between large and small pulses based on object size and speed, and work in groups to record data. This session combines play, prediction, and observation, setting the stage for future MeasureLab experiments and teaching foundational skills in data interpretation and teamwork.
Equipment Required:
- MeasureLab with Photogate sensor connected to a laptop or PC for displaying live plots.
- Small, medium, and large objects (e.g., erasers, pencils, paper balls, small blocks) for passing through the sensor.
- Worksheet for recording predictions, observations, and results.
- Pens, pencils, and markers for writing and marking observations.
Learning Objectives:
By the end of this session, students will:
- Understand the purpose of MeasureLab and how it can help us observe and measure object movement.
- Use the Photogate sensor to detect objects passing through and observe the resulting pulses on a live plot.
- Identify how object size and speed affect the duration of pulses.
- Work in groups to predict, observe, and record results, developing teamwork and early data interpretation skills.
Teaching Aids:
- Projector (optional, for displaying live plot data in real time).
- Whiteboard or chart paper to list students’ ideas and build knowledge.
Teacher Resource:
Session File: ML41.plf (55.9 KB)
Preparation:
This step has to be done before the session on each workstation/apparatus by the teacher/session instructor:
-
Make sure that each computer has Physlogger installed and can detect the Measrelab when connected to it using the provided cable.
-
Each Measurelab should have access to a power outlet for sensors that require external power.
-
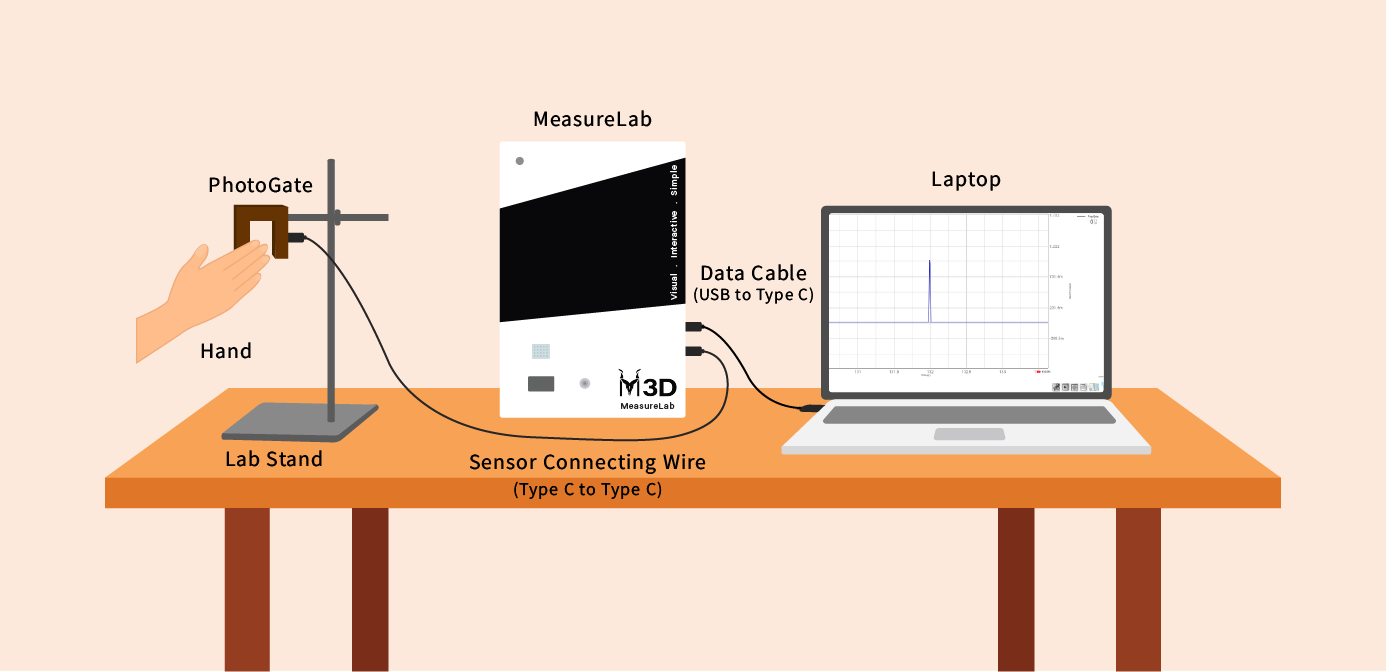
Connect the Photogate to the Measurelab using the following port:
-
Launch the Physlogger application and load the session file provided in the resources section.

Your setup will look something like this:
1. Introduction and Discussion (10-15 minutes)
Engagement Question: Starting with Curiosity
Begin by capturing the students’ attention with an open-ended question:
“Have you ever wondered how scientists or engineers measure things like speed or movement? What kinds of tools do you think they might use?”
Encourage students to share their guesses, noting all ideas on the board (e.g., “speedometer,” “stopwatch,” “motion sensor”). This will help set the context and create excitement.
Introducing MeasureLab
- Transition by saying: “Today, you’ll get to try out one of these tools, a special kind of lab we call MeasureLab. What do you think we might be able to measure with it?”
- Let students brainstorm ideas—whether realistic or imaginative—as this will spark curiosity.
Explaining the Photogate Sensor
- Introduce the Photogate sensor and its purpose:
“This tool can tell us if something passes through it, showing a pulse on the screen when an object goes by. We’re going to see what kinds of patterns we can make with these pulses based on the objects we use!”
2. Demonstrating the Photogate Sensor (10 minutes)
Step 1: Single-Object Demonstration
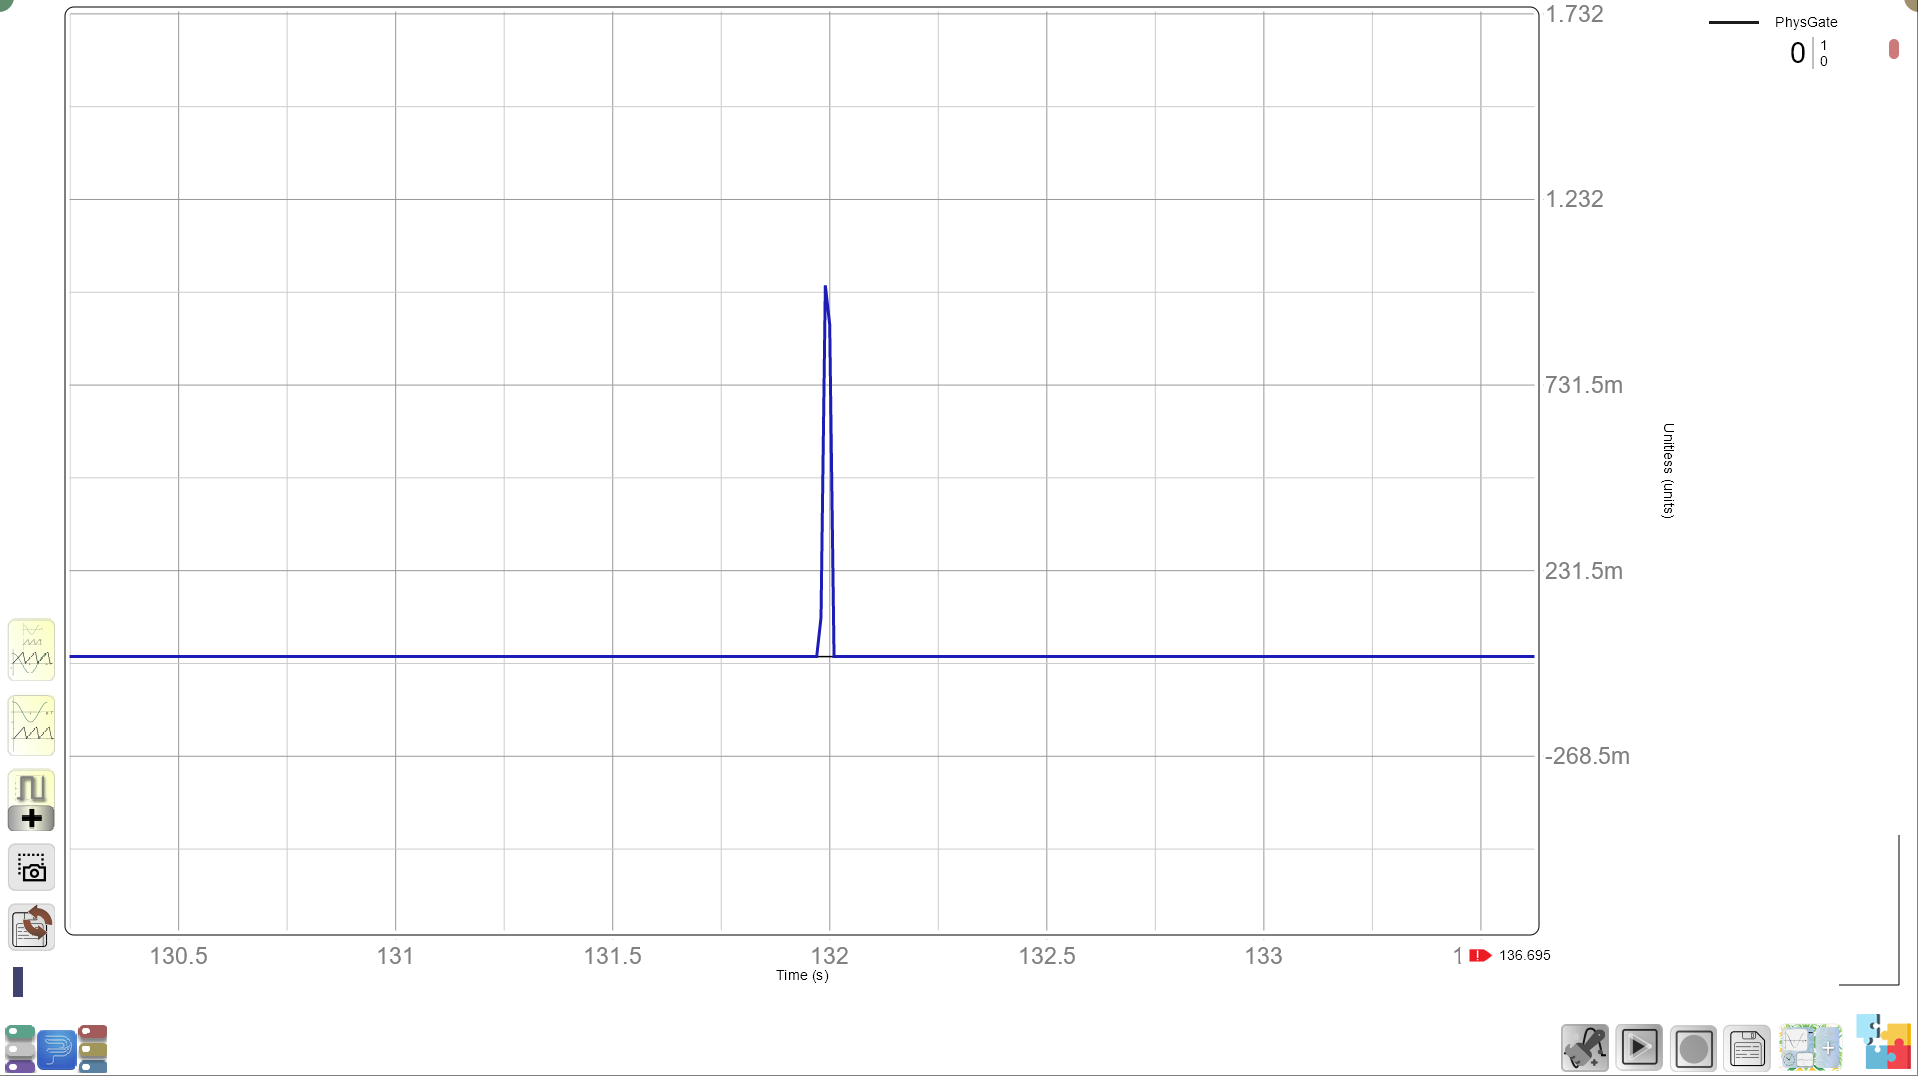
- Demonstrate the Photogate by passing a single finger through it. Point out the pulse on the live plot and explain how this pulse represents the object passing through the sensor.
You may ask:
“What do you see on the screen when my finger goes through the sensor? What does the pulse look like?”
Step 2: Multiple-Object Demonstration
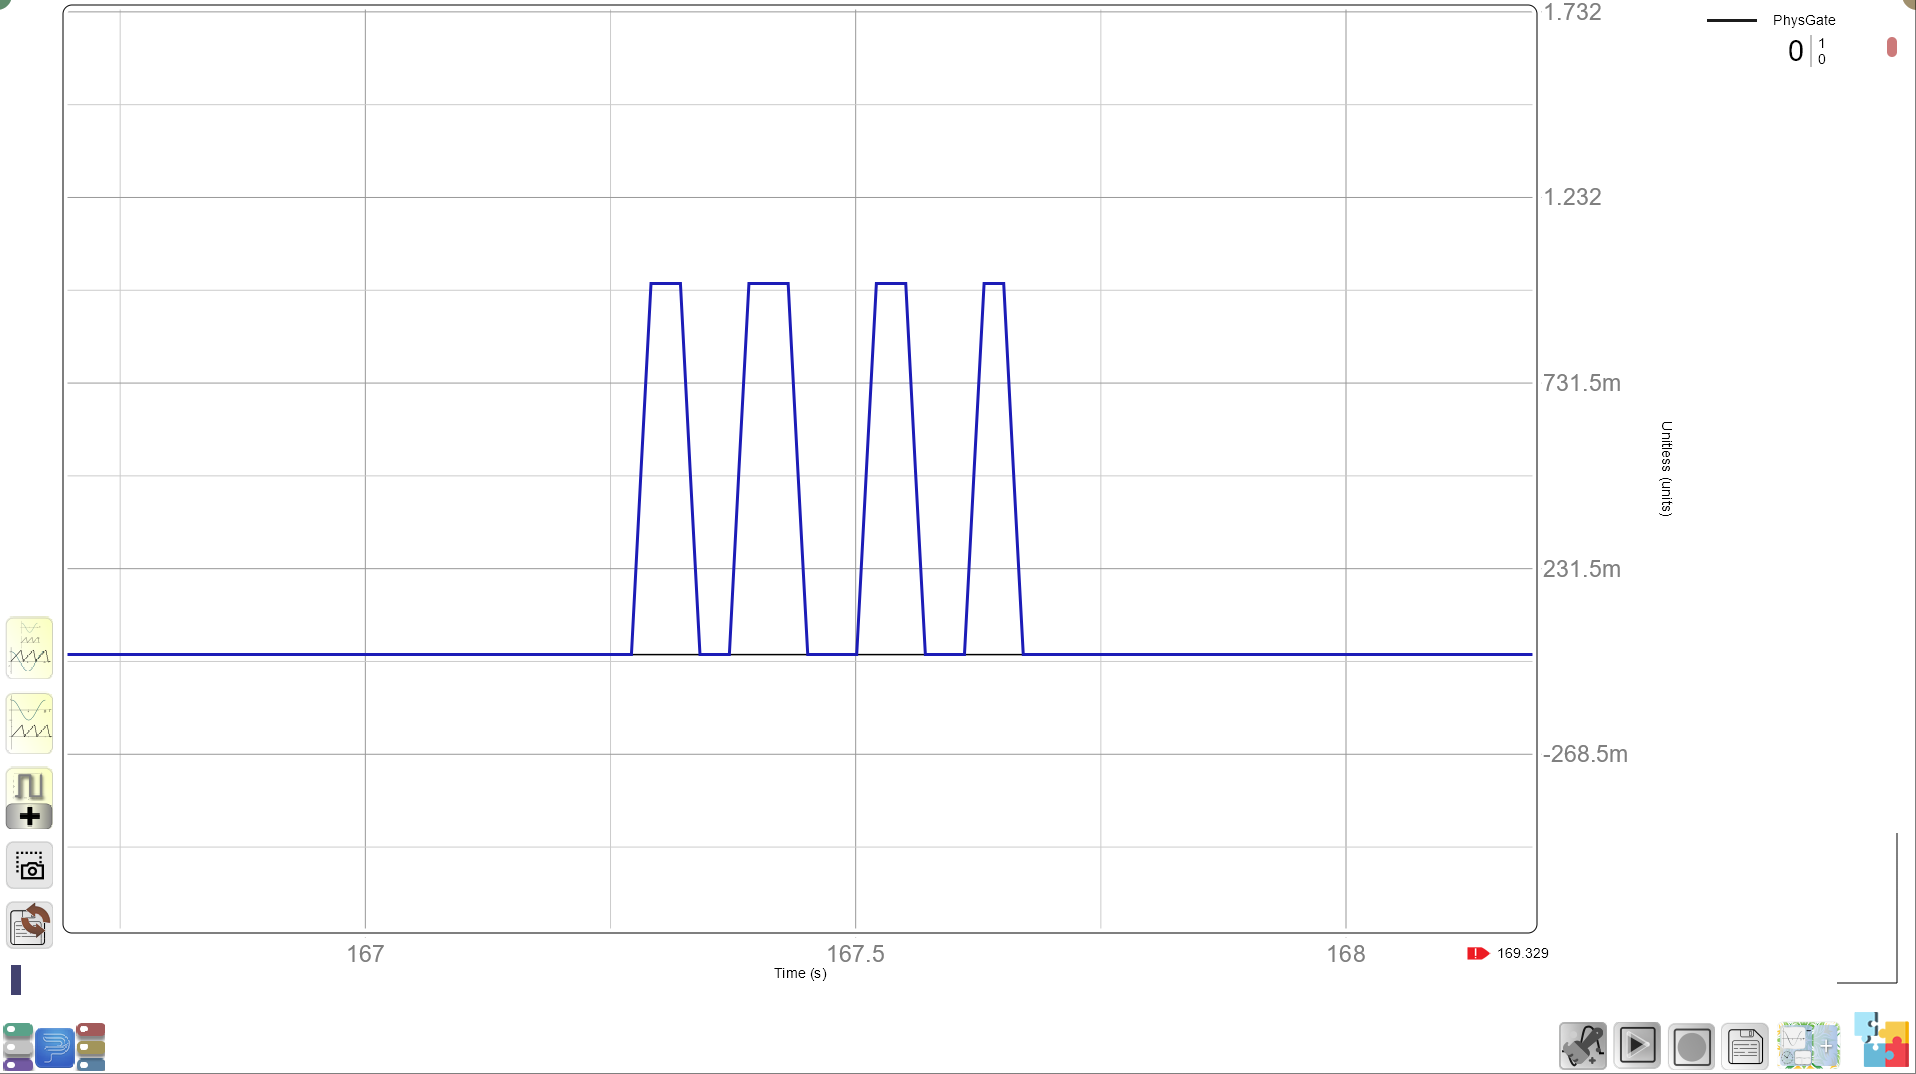
- Next, pass multiple fingers through one at a time, spaced slightly apart. Let students observe the multiple pulses and ask:
“How many pulses do you see now? Why do you think there are more pulses this time?”
- Explain that each pulse represents one object passing through the sensor.
3. Hands-On Activity: Finger Counting in Groups (15 minutes)
Setting Up the Activity
- Divide students into small groups and hand out the worksheets. Assign roles within each group: one student will pass their fingers through the Photogate, while another watches the screen and counts the pulses, recording the data on the worksheet.
Predict and Observe
- Before they begin, ask students to make a prediction:
“How many pulses do you think you’ll see if you pass two fingers? What if you pass three fingers?”
- Each group will take turns, with the “passer” moving one, two, or three fingers through the Photogate, and the “recorder” counting and noting the number of pulses they see.
Worksheet Example: Measured vs. Actual Table
| Number of Fingers Passed | Predicted Number of Pulses | Actual Number of Pulses | Was Prediction Correct? (Yes/No) | Possible Source of Error |
|---|---|---|---|---|
| 1 | ||||
| 2 | ||||
| 3 |
Reflection and Discussion
- After a few rounds, ask:
“Did the number of pulses always match your predictions? If not, what could have caused any differences?”
- Encourage students to consider potential sources of error, such as moving fingers too quickly, accidentally spacing fingers too close together, or any delay in observation.
4. Exploring Object Size and Speed with the Photogate (15 minutes)
Expanding on the Pulse Observation
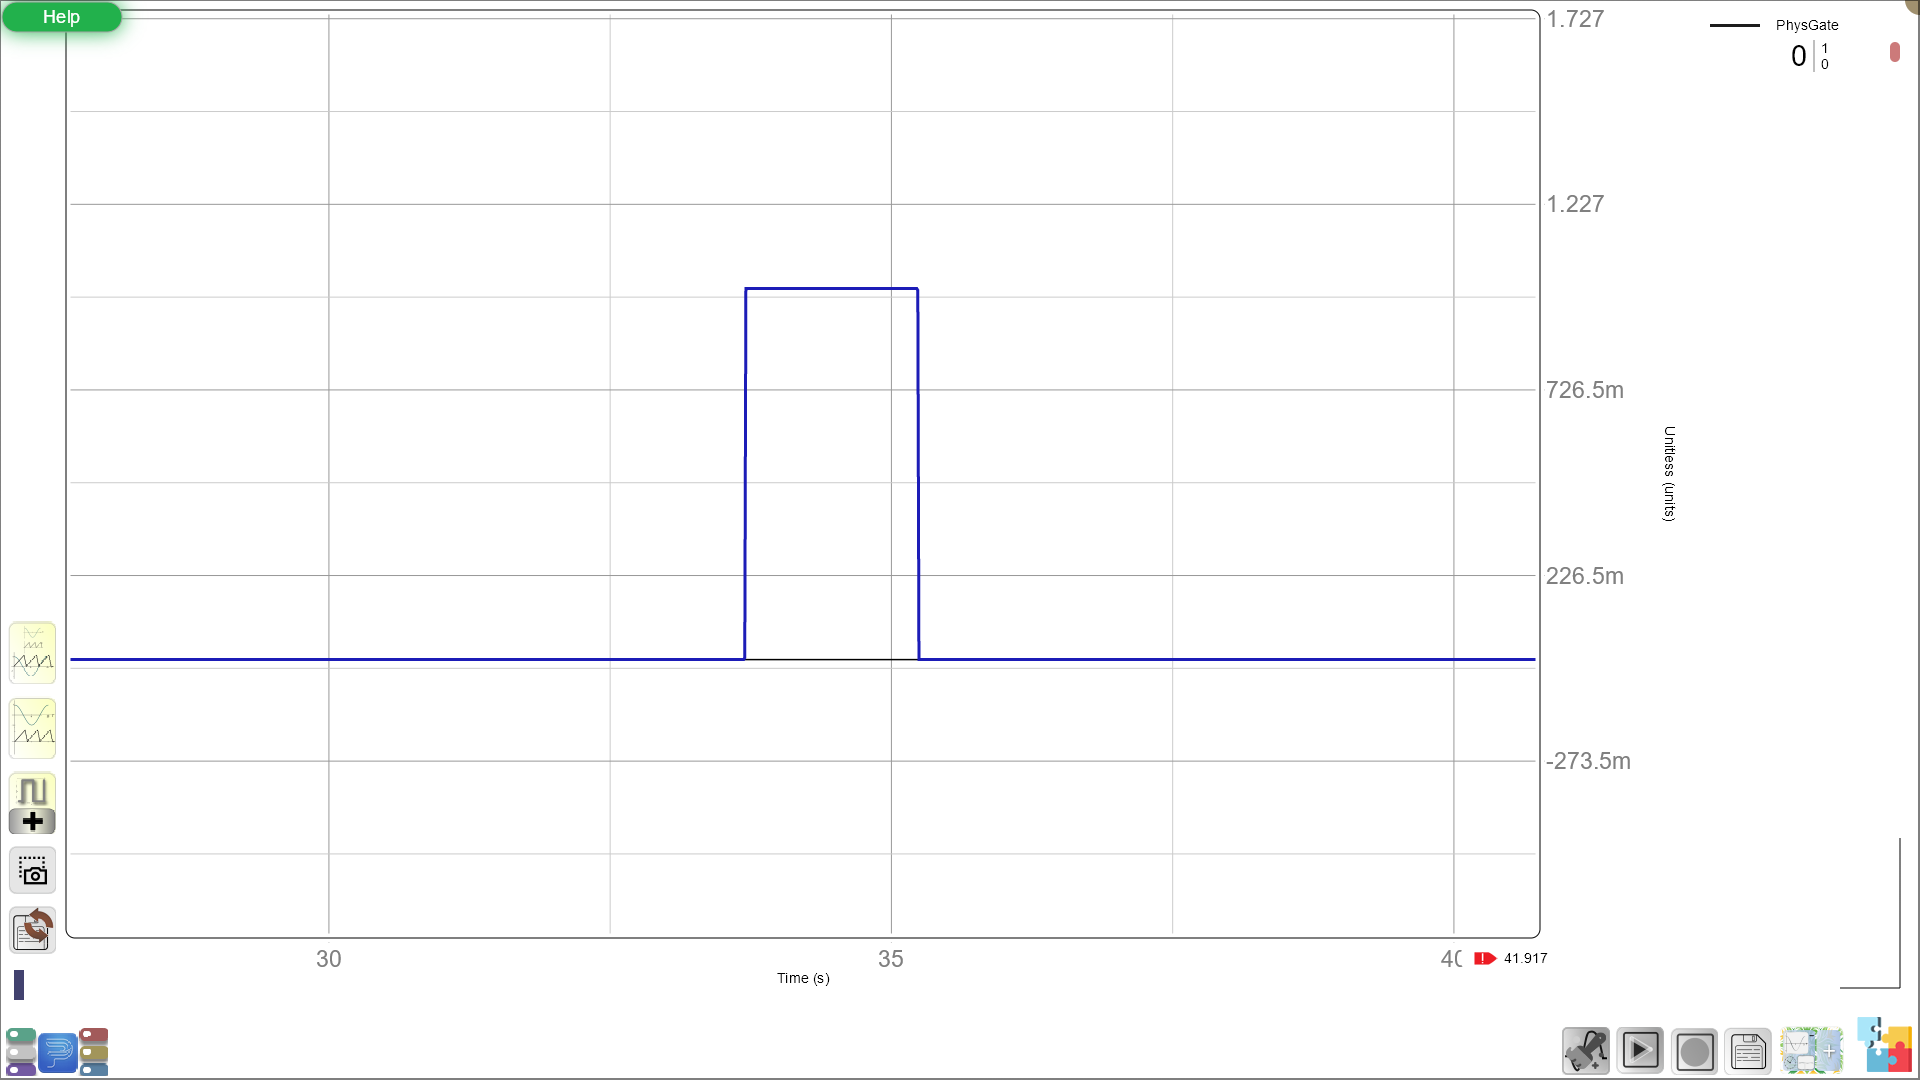
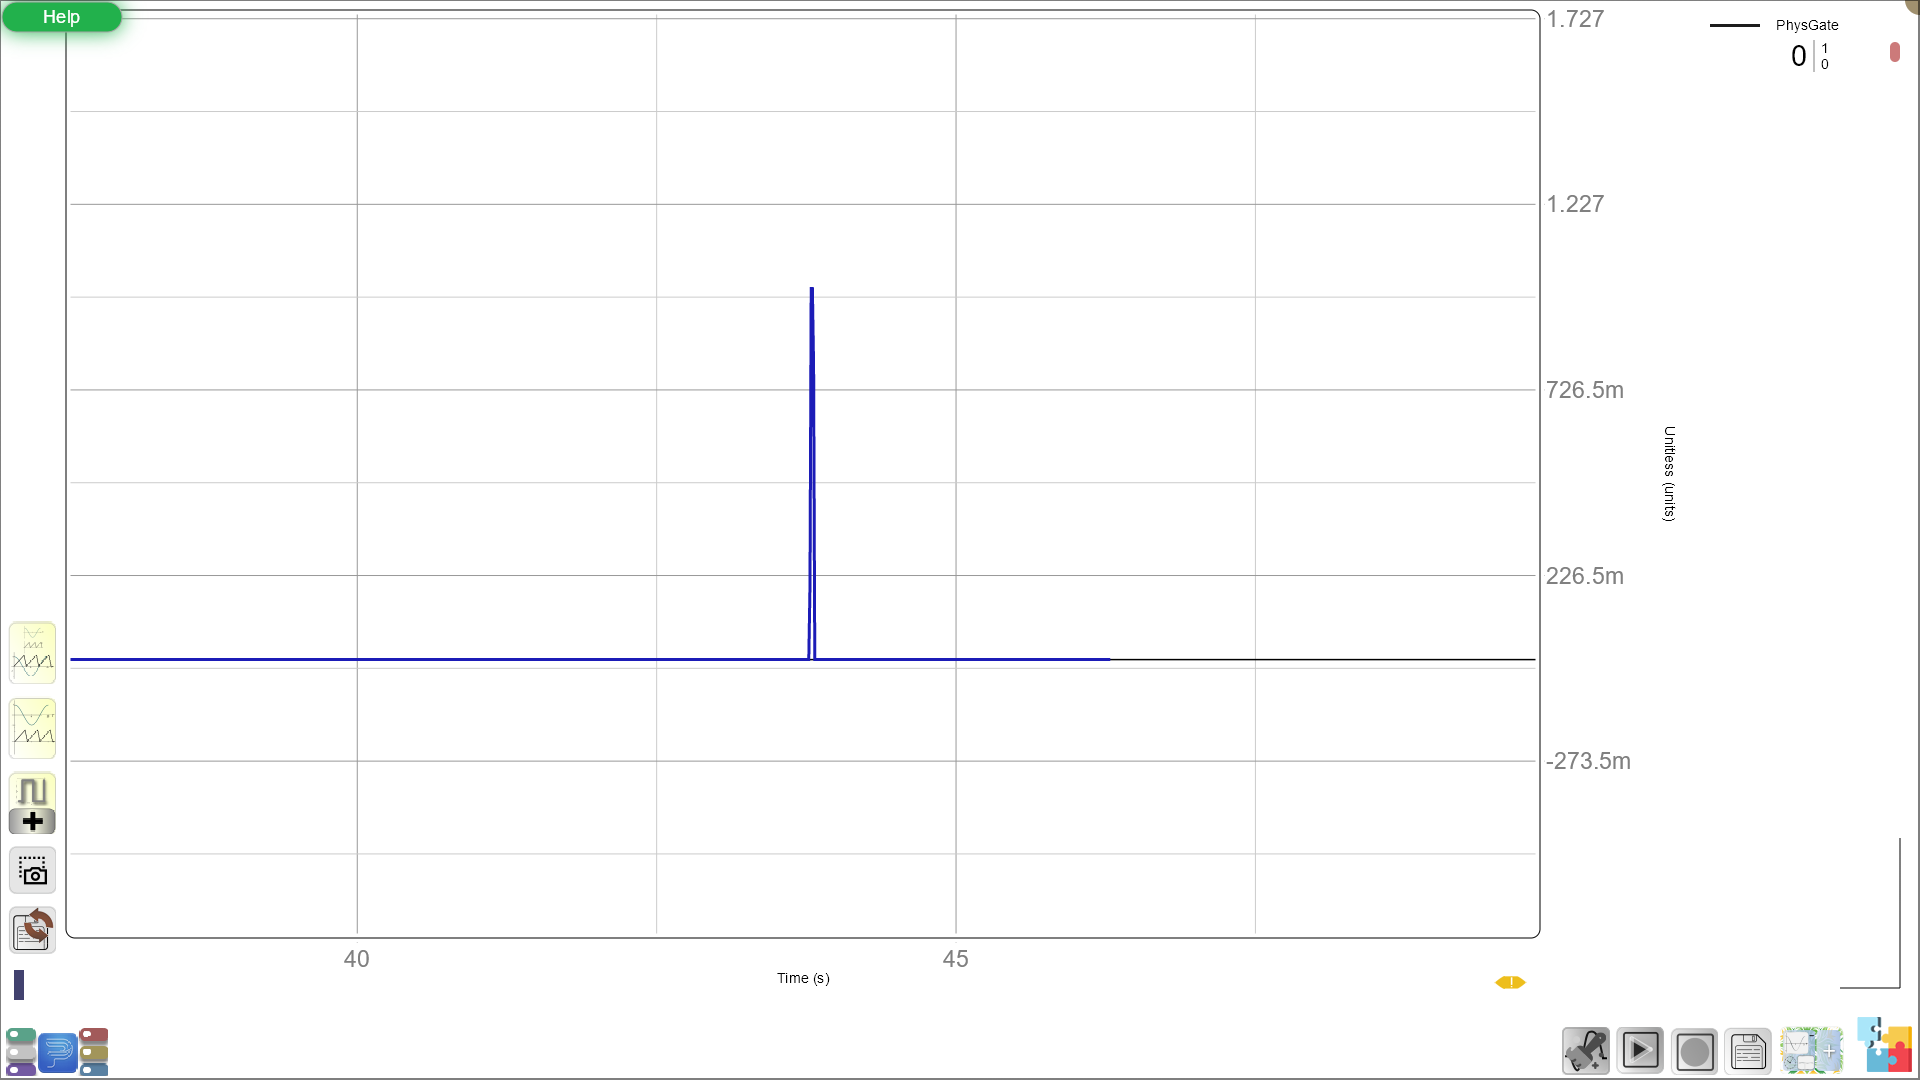
- Now introduce the concept of pulse length by passing a large object (e.g., a small block) through the Photogate slowly, followed by a small object (e.g., an eraser) quickly.
- Ask students:
“What do you notice about the pulse when I pass a larger object? How does it change when the object moves slower or faster?”
Large Object/Slow Object:
Small Objects/Fast Object:
Guided Group Exploration
- In groups, let students experiment with different objects and speeds, recording observations on the worksheet. One student passes an object, while another records whether it created a long or short pulse.
Worksheet Example: Object Size and Speed Table
| Object Passed | Pulse Length (Short/Long) | Object Size (Small/Large) | Observed Speed (Slow/Fast) | Was Prediction Correct? (Yes/No) | Possible Source of Error |
|---|---|---|---|---|---|
| Eraser | |||||
| Small Block | |||||
| Paper Ball | |||||
| Car (Moving Fast) | |||||
| Car (Moving Slow) |
Discussing Observations
- After a few rounds, gather students and ask:
“Did your predictions about the pulse length match what you saw? If not, why do you think there was a difference?”
- Guide them to consider sources of error, such as inconsistencies in object speed, variations in object size, or misreading the pulse on the screen.
Highlight Key Findings
- Summarize the main observations:
“Remember, a larger pulse usually means the object was either big or moving slowly, while a shorter pulse can mean the object was small or moved quickly.”
5. Reflection and Wrap-Up (5-10 minutes)
Reflection Questions
- Engage students with a few reflective questions to consolidate their learning:
- “What surprised you about the patterns we saw on the screen?”
- “How do you think we could use this tool to measure things in the real world?”
- “Did any of your results not match what you expected? What might have caused that?”
Real-World Connection
- Conclude with a brief discussion on how similar sensors are used in everyday life.
- “Did you know that sensors like these are used to open doors, check how fast cars are going, and even measure how fast athletes are running? Today, you were like real scientists exploring how things move!”
Glossary
- MeasureLab: A tool used to observe and measure movement and other scientific data.
- Photogate: A sensor that detects when an object passes through it.
- Pulse: A quick, distinct signal on the screen indicating a momentary detection or change in the system.
- Prediction: A guess about what we think will happen in our experiment.
- Error: A difference between what we expected and what actually happened, which can occur due to mistakes or small changes.