Grade 7 - Session 5: “Investigating Thermal Conductivity”
Session Architect: Aleeza Ayaz - Markhor3D
Session Length: 60-70 minutes
Learning Objectives:
In this session, students will:
- Understand thermal conductivity and how different materials transfer heat.
- Use temperature sensors to measure how heat moves through different metals (conductors) and other materials.
- Compare the thermal conductivity of different materials based on how fast temperature changes along the rod.
- Discuss real-world applications of thermal conductivity, such as in cooking utensils or building insulation.
- Learn how to graph data and analyze the relationship between time, temperature, and material type.
Teacher Resource:
Session File: ML75.plf (60.3 KB)
Equipment Required:
- PC/Laptop to display measurement and live plot
- MeasureLab with built-in temperature sensors attached with temperature probes.
- Metal rods made of different materials (e.g., copper, aluminum, steel).
- Other materials for comparison (e.g., plastic, wood, rubber).
- Hot plate or boiling water bath to heat one end of the rods.
- Timer or stopwatch.
- Heatproof gloves and stands for holding the rods.
- Worksheet for recording observations and data.
- Pens, pencils, markers, etc.
Preparation:
This step has to be done before the session on each workstation/apparatus by the teacher/session instructor:
- Make sure that each computer has Physlogger installed and can detect the Measrelab when connected to it using the provided cable.
- Each Measurelab should have access to a power outlet for sensors that require external power. For this session, Temperature Sensor Probe will be used which require an external power source.
- Connect the Temperature Sensor to the Measurelab using the following port:

- Launch the Physlogger application and load the session file provided in the resources section.
Your setup will look something like this:
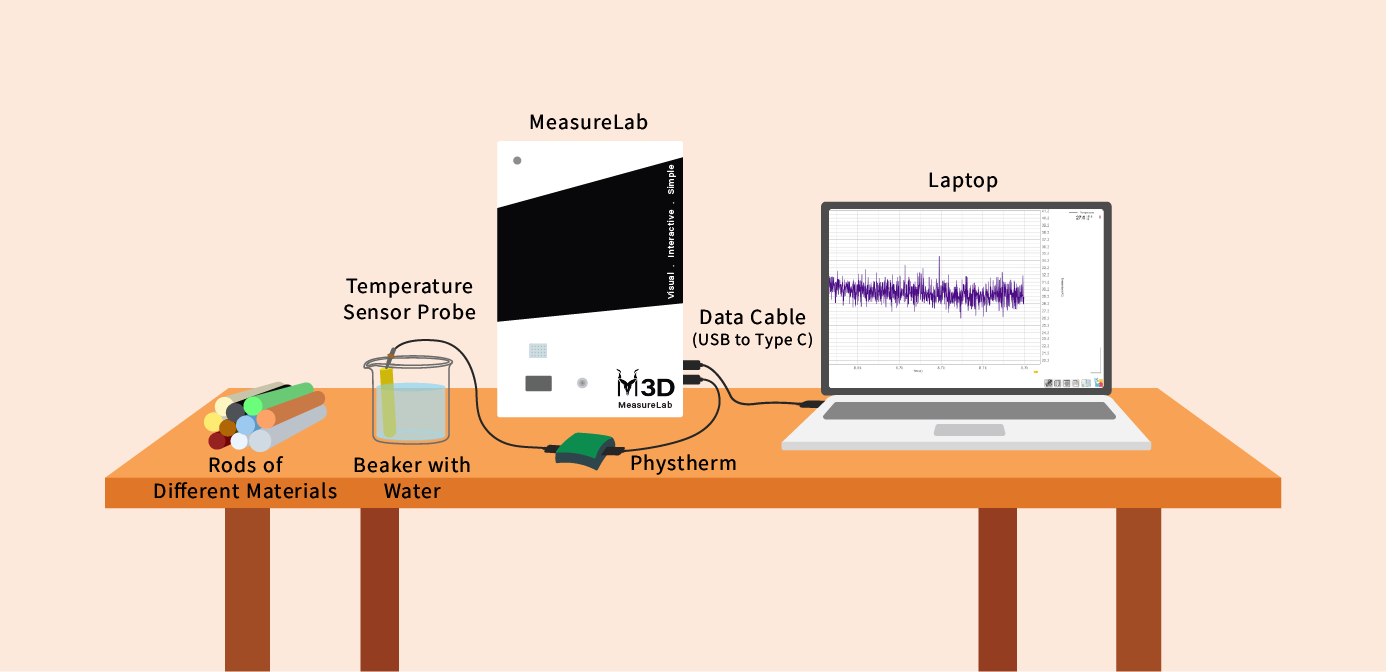
- Set up the apparatus as shown in the diagram above.
Introduction and Hands-On Exploration: (35-40 minutes)
Start with an Engaging Question:
- You may start by asking:
“Have you ever noticed how the handle of a metal spoon heats up quickly when you leave it in a pot of boiling water? But what happens if the handle is made of wood or plastic instead?”
- Let students share their experiences and thoughts about how different materials heat up.
What is Thermal Conductivity?
- You may build on their responses by explaining:
“The reason metal gets hotter faster than wood or plastic is because of something called thermal conductivity. This is how well a material transfers heat from one part of it to another.”
- You may ask:
“Which materials do you think will conduct heat the best—metal, wood, or plastic? Why do you think that?”
- Have students write down their predictions in their worksheets.
Setting Up the Experiment:
Procedure:
-
Prepare the Materials:
- Each group will have rods of different materials (copper, aluminum, steel, plastic, and wood).
- Set up the rods horizontally, with one end resting on a hot plate or in a boiling water bath to heat the rods.
- Attach temperature sensor probe on the rod at different points to measure how fast heat travels down the length of the rods.
-
Start Heating the Rods:
- Turn on the hot plate or place the rod ends in boiling water, making sure to heat only one end of each rod.
- You may ask:
“What do you think will happen as the rods heat up? Will all the materials heat up at the same rate?”
- Students should observe the temperature sensors and record the temperature at each position along the rods every 2 minutes for 10-15 minutes.
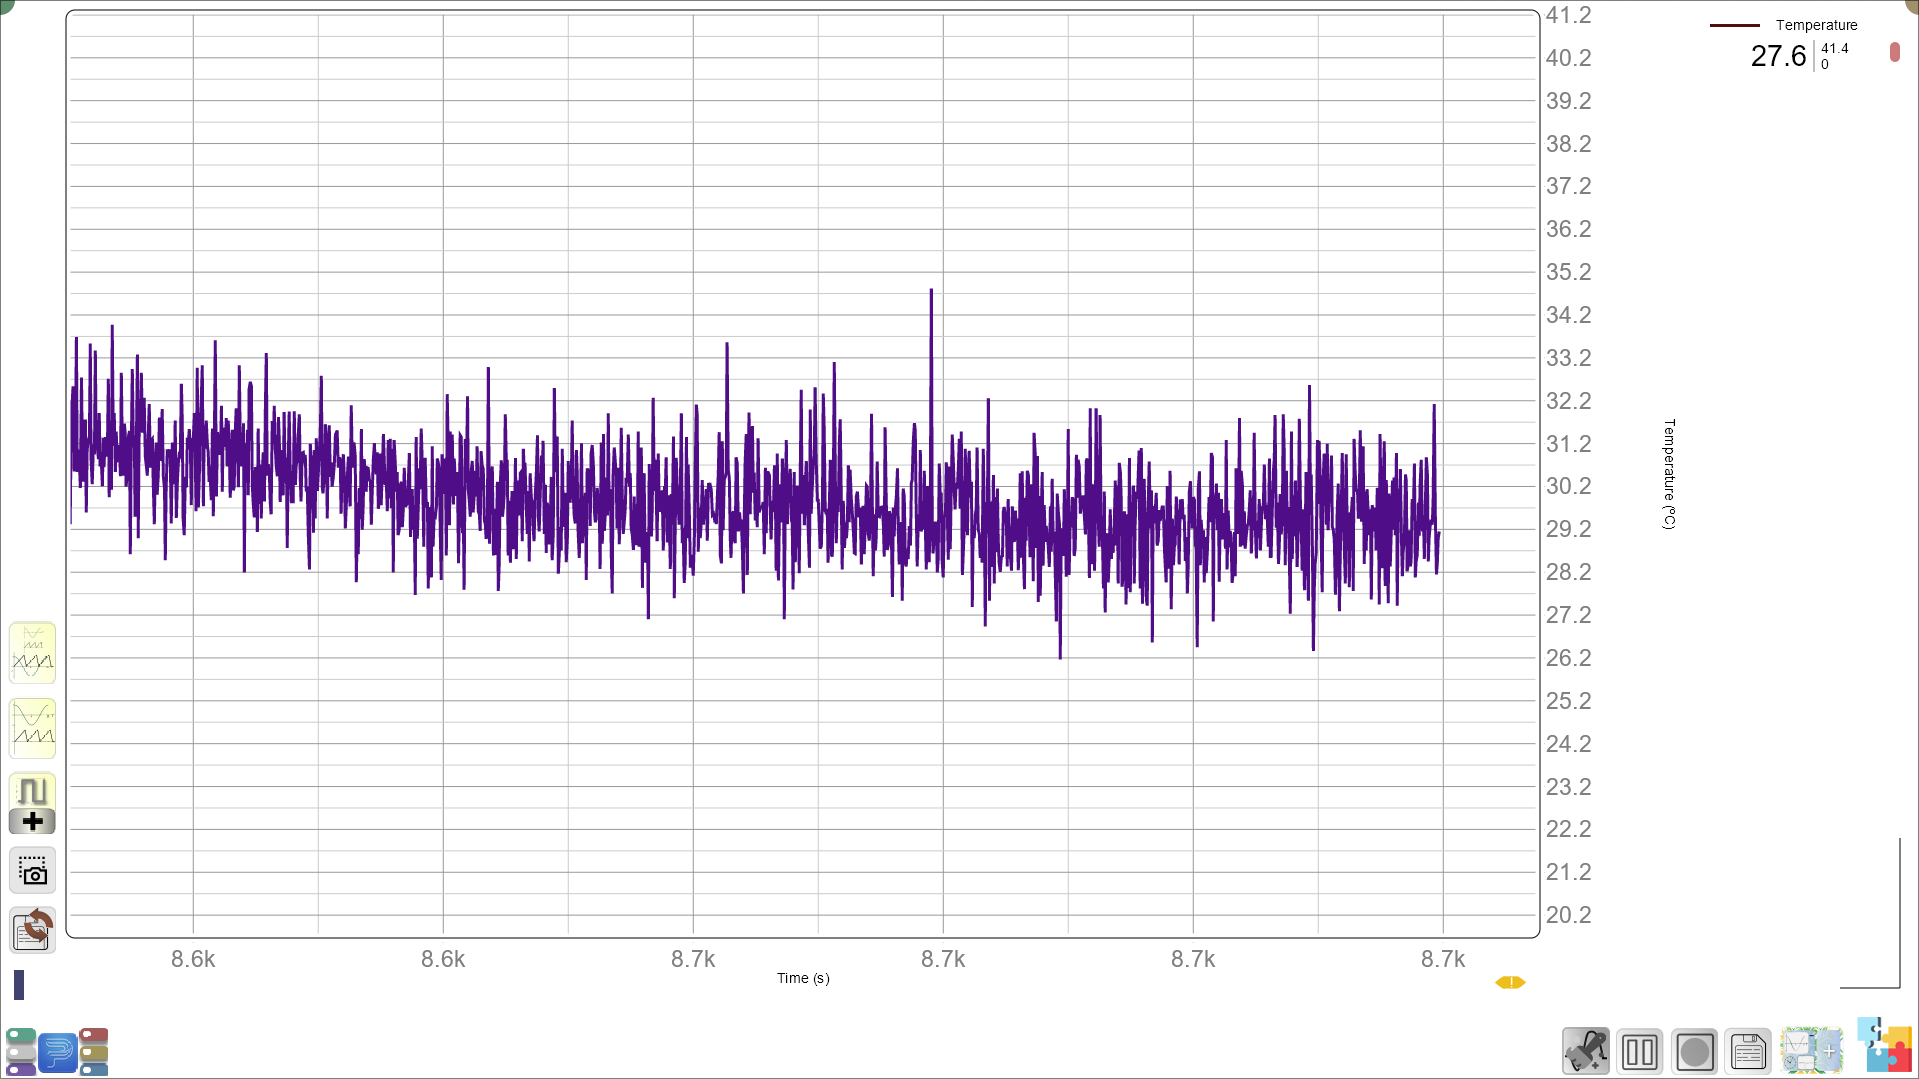
- They will analyse and discuss the live plot and wait until the live plot goes straight to indicate the temperature is now same throughout the object.
Recording Data:
- Students will record the temperature at different points on each rod in their worksheet:
| Time (minutes) | Copper (°C) | Aluminum (°C) | Steel (°C) | Plastic (°C) | Wood (°C) |
|---|---|---|---|---|---|
| 0 | |||||
| 2 | |||||
| 4 | |||||
| 6 | |||||
| 8 | |||||
| 10 |
Guided Reflection and Exploration: (15-20 minutes):
Discussion of Results:
-
After recording the data, guide students to reflect on the experiment:
- You may ask:
“Which material heated up the fastest? Which heated up the slowest? Why do you think that happened? How did we know from the live plot that the temperature is now the same throughout the object? What does a live plots steepness tell us?”
- Encourage students to share their observations and analyze the results.
Graphing the Data:
- Plotting the Data:
- Students will create a graph with time (x-axis) and temperature (y-axis) for each material.
- You may ask:
“What do you notice about the shape of the graph for each material? Which material shows the steepest slope, and what does that mean for thermal conductivity?”
Worksheet Section:
- Recording Data and Observations:
| Material | Prediction (Fastest/Slowest) | Final Temperature (°C) | Conductivity Rank (1 = highest) |
|---|---|---|---|
| Copper | |||
| Aluminum | |||
| Steel | |||
| Plastic | |||
| Wood |
- Follow-up Questions:
- Which material had the highest thermal conductivity?
- Why do you think copper heats up faster than wood or plastic?
- How could knowing the thermal conductivity of a material be useful in real life?
- How does the shape of the graph show differences in how fast materials conduct heat?
- Guide students to compare the different lines on their graphs, focusing on which material’s temperature increased the fastest (showing the highest thermal conductivity).
- You may ask:
“Which material had the highest thermal conductivity based on your graph? How can you tell from the shape of the graph?”
Applying Real-World Connections:
- You may explain:
“Thermal conductivity is important in everyday life. For example, cooking pots are made of materials like metal because they conduct heat well, helping food cook evenly. On the other hand, handles are made of materials like plastic or wood because they don’t conduct heat as well, so you don’t burn your hand.”
-
You may ask:
“Can you think of other examples in real life where it’s important to know how well a material conducts heat?”- Examples: Insulation in buildings, heat sinks in electronics, or blankets keeping us warm.
Conclusion and Summary: (5 minutes):
- You may summarize:
“Today, we learned that different materials conduct heat at different rates. Metals like copper and aluminum conduct heat very quickly, while materials like plastic and wood don’t conduct heat as well.”
- Real-world connection:
“Understanding thermal conductivity helps us choose the right materials for different jobs. For example, if you want to make a cooking pot, you need a material that conducts heat well, but for a handle, you need something that doesn’t conduct heat easily.”
Glossary:
- Thermal Conductivity: The ability of a material to transfer heat.
- Heat Transfer: The movement of heat from one part of a material to another.
- Conductor: A material that allows heat to flow through it easily (e.g., metals).
- Insulator: A material that does not transfer heat well (e.g., wood, plastic).
- Temperature: A measure of how hot or cold something is.
- Time: The duration over which the heat transfer is measured.